Irish vs Afghan Cognitive Disability
COMPARE
Irish
Afghan
Cognitive Disability
Cognitive Disability Comparison
Irish
Afghans
16.8%
COGNITIVE DISABILITY
98.1/ 100
METRIC RATING
102nd/ 347
METRIC RANK
17.3%
COGNITIVE DISABILITY
38.2/ 100
METRIC RATING
185th/ 347
METRIC RANK
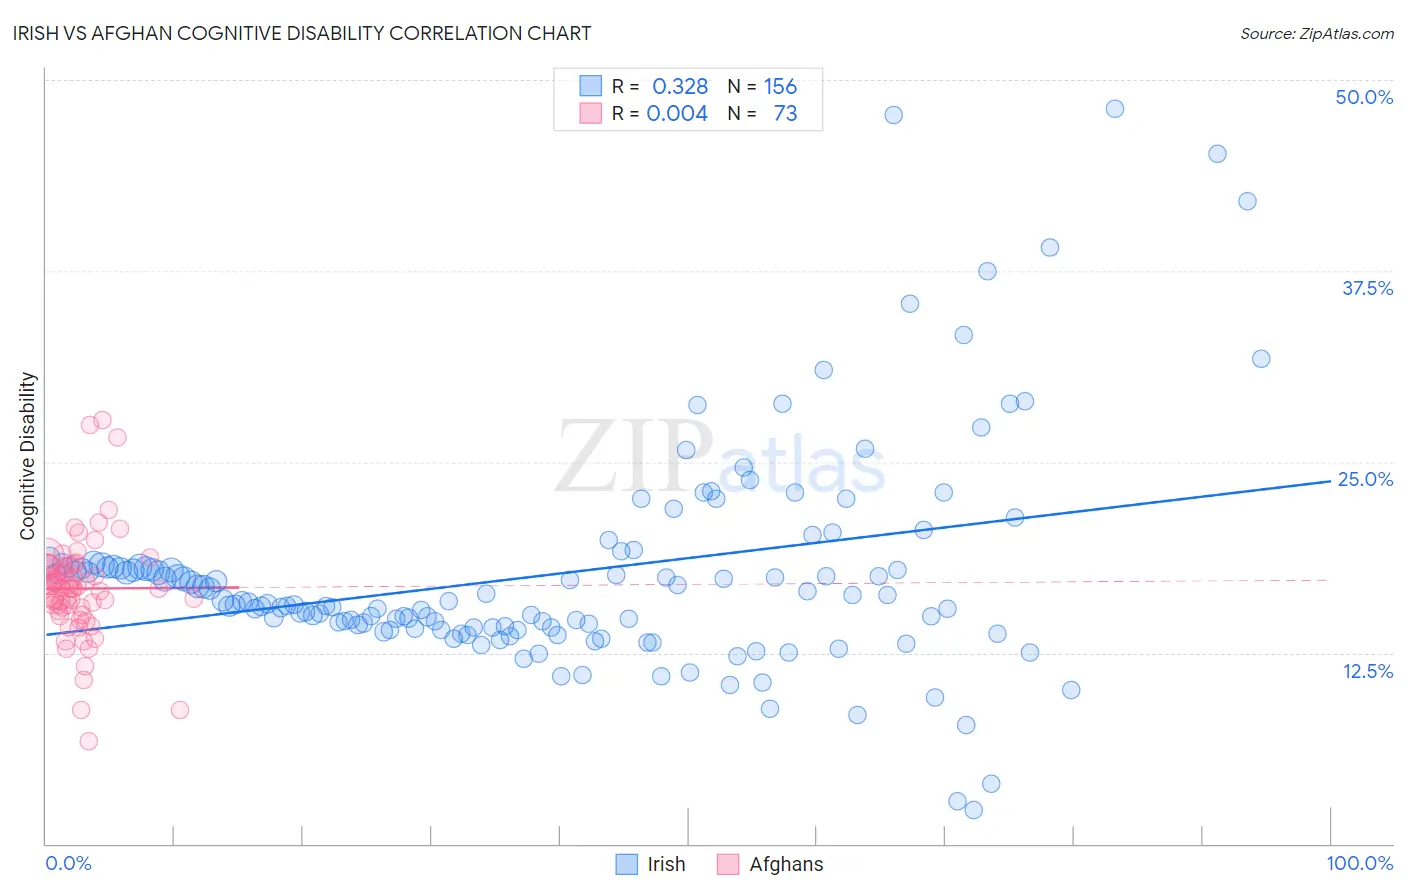
Irish vs Afghan Cognitive Disability Correlation Chart
The statistical analysis conducted on geographies consisting of 580,428,608 people shows a mild positive correlation between the proportion of Irish and percentage of population with cognitive disability in the United States with a correlation coefficient (R) of 0.328 and weighted average of 16.8%. Similarly, the statistical analysis conducted on geographies consisting of 148,870,382 people shows no correlation between the proportion of Afghans and percentage of population with cognitive disability in the United States with a correlation coefficient (R) of 0.004 and weighted average of 17.3%, a difference of 3.2%.
Cognitive Disability Correlation Summary
| Measurement | Irish | Afghan |
| Minimum | 2.2% | 6.7% |
| Maximum | 48.1% | 27.8% |
| Range | 45.9% | 21.0% |
| Mean | 17.7% | 16.7% |
| Median | 15.8% | 16.7% |
| Interquartile 25% (IQ1) | 14.1% | 15.3% |
| Interquartile 75% (IQ3) | 18.1% | 18.2% |
| Interquartile Range (IQR) | 4.0% | 2.9% |
| Standard Deviation (Sample) | 7.3% | 3.5% |
| Standard Deviation (Population) | 7.2% | 3.5% |
Similar Demographics by Cognitive Disability
Demographics Similar to Irish by Cognitive Disability
In terms of cognitive disability, the demographic groups most similar to Irish are Immigrants from Russia (16.8%, a difference of 0.030%), Immigrants from Asia (16.8%, a difference of 0.030%), Paraguayan (16.8%, a difference of 0.050%), Palestinian (16.8%, a difference of 0.050%), and Jordanian (16.8%, a difference of 0.060%).
| Demographics | Rating | Rank | Cognitive Disability |
| English | 98.6 /100 | #95 | Exceptional 16.8% |
| Finns | 98.5 /100 | #96 | Exceptional 16.8% |
| Dutch | 98.5 /100 | #97 | Exceptional 16.8% |
| Immigrants | Lebanon | 98.4 /100 | #98 | Exceptional 16.8% |
| Jordanians | 98.2 /100 | #99 | Exceptional 16.8% |
| Immigrants | Russia | 98.2 /100 | #100 | Exceptional 16.8% |
| Immigrants | Asia | 98.1 /100 | #101 | Exceptional 16.8% |
| Irish | 98.1 /100 | #102 | Exceptional 16.8% |
| Paraguayans | 98.0 /100 | #103 | Exceptional 16.8% |
| Palestinians | 98.0 /100 | #104 | Exceptional 16.8% |
| Immigrants | Eastern Asia | 97.9 /100 | #105 | Exceptional 16.8% |
| Northern Europeans | 97.8 /100 | #106 | Exceptional 16.8% |
| Immigrants | Nicaragua | 97.8 /100 | #107 | Exceptional 16.8% |
| Canadians | 97.5 /100 | #108 | Exceptional 16.8% |
| Albanians | 97.3 /100 | #109 | Exceptional 16.8% |
Demographics Similar to Afghans by Cognitive Disability
In terms of cognitive disability, the demographic groups most similar to Afghans are Crow (17.3%, a difference of 0.030%), Spaniard (17.3%, a difference of 0.060%), Cambodian (17.3%, a difference of 0.070%), Immigrants from Guyana (17.3%, a difference of 0.14%), and Arab (17.3%, a difference of 0.14%).
| Demographics | Rating | Rank | Cognitive Disability |
| Spanish | 48.9 /100 | #178 | Average 17.3% |
| Sioux | 48.6 /100 | #179 | Average 17.3% |
| Pakistanis | 43.9 /100 | #180 | Average 17.3% |
| Immigrants | Guyana | 42.9 /100 | #181 | Average 17.3% |
| Arabs | 42.8 /100 | #182 | Average 17.3% |
| Spaniards | 40.3 /100 | #183 | Average 17.3% |
| Crow | 39.1 /100 | #184 | Fair 17.3% |
| Afghans | 38.2 /100 | #185 | Fair 17.3% |
| Cambodians | 35.9 /100 | #186 | Fair 17.3% |
| Immigrants | Fiji | 33.7 /100 | #187 | Fair 17.4% |
| Immigrants | France | 29.8 /100 | #188 | Fair 17.4% |
| Immigrants | Western Asia | 29.5 /100 | #189 | Fair 17.4% |
| Immigrants | Spain | 27.7 /100 | #190 | Fair 17.4% |
| Immigrants | Nonimmigrants | 27.4 /100 | #191 | Fair 17.4% |
| Immigrants | Haiti | 27.1 /100 | #192 | Fair 17.4% |