Irish vs Cajun Disability Age 65 to 74
COMPARE
Irish
Cajun
Disability Age 65 to 74
Disability Age 65 to 74 Comparison
Irish
Cajuns
23.4%
DISABILITY AGE 65 TO 74
44.4/ 100
METRIC RATING
182nd/ 347
METRIC RANK
27.9%
DISABILITY AGE 65 TO 74
0.0/ 100
METRIC RATING
315th/ 347
METRIC RANK
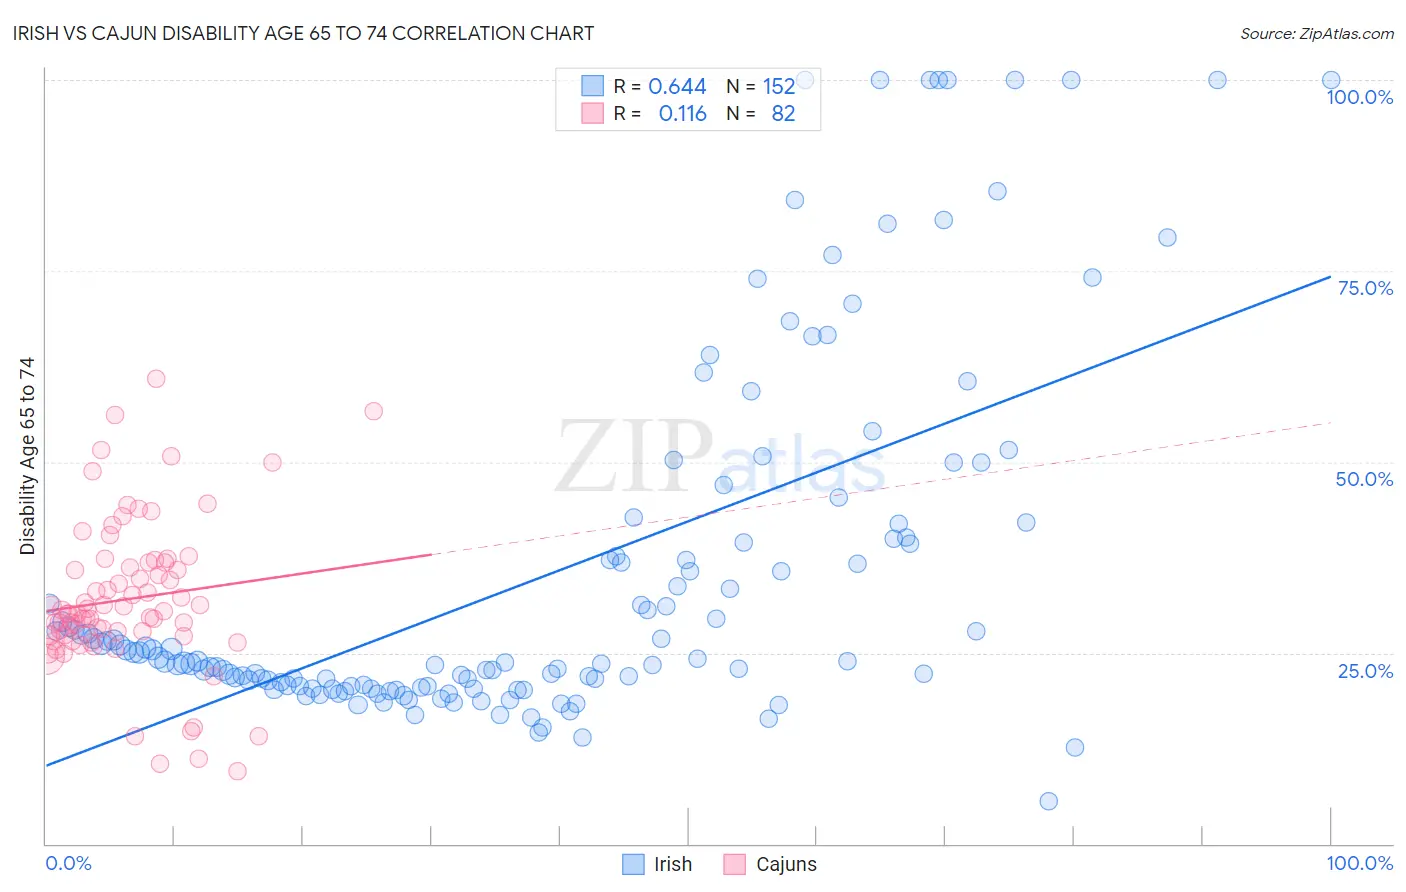
Irish vs Cajun Disability Age 65 to 74 Correlation Chart
The statistical analysis conducted on geographies consisting of 577,447,046 people shows a significant positive correlation between the proportion of Irish and percentage of population with a disability between the ages 65 and 75 in the United States with a correlation coefficient (R) of 0.644 and weighted average of 23.4%. Similarly, the statistical analysis conducted on geographies consisting of 149,600,778 people shows a poor positive correlation between the proportion of Cajuns and percentage of population with a disability between the ages 65 and 75 in the United States with a correlation coefficient (R) of 0.116 and weighted average of 27.9%, a difference of 19.3%.
Disability Age 65 to 74 Correlation Summary
| Measurement | Irish | Cajun |
| Minimum | 5.6% | 9.5% |
| Maximum | 100.0% | 61.0% |
| Range | 94.4% | 51.5% |
| Mean | 35.1% | 32.0% |
| Median | 23.9% | 30.3% |
| Interquartile 25% (IQ1) | 20.6% | 27.3% |
| Interquartile 75% (IQ3) | 39.7% | 36.8% |
| Interquartile Range (IQR) | 19.1% | 9.5% |
| Standard Deviation (Sample) | 23.3% | 9.9% |
| Standard Deviation (Population) | 23.3% | 9.9% |
Similar Demographics by Disability Age 65 to 74
Demographics Similar to Irish by Disability Age 65 to 74
In terms of disability age 65 to 74, the demographic groups most similar to Irish are Assyrian/Chaldean/Syriac (23.4%, a difference of 0.060%), Scandinavian (23.4%, a difference of 0.070%), Immigrants from Sierra Leone (23.4%, a difference of 0.080%), Guyanese (23.4%, a difference of 0.090%), and Immigrants from Eastern Africa (23.4%, a difference of 0.090%).
| Demographics | Rating | Rank | Disability Age 65 to 74 |
| Dutch | 49.4 /100 | #175 | Average 23.3% |
| Immigrants | Eritrea | 47.5 /100 | #176 | Average 23.4% |
| Immigrants | Haiti | 47.5 /100 | #177 | Average 23.4% |
| Guyanese | 45.8 /100 | #178 | Average 23.4% |
| Immigrants | Sierra Leone | 45.8 /100 | #179 | Average 23.4% |
| Scandinavians | 45.6 /100 | #180 | Average 23.4% |
| Assyrians/Chaldeans/Syriacs | 45.3 /100 | #181 | Average 23.4% |
| Irish | 44.4 /100 | #182 | Average 23.4% |
| Immigrants | Eastern Africa | 42.8 /100 | #183 | Average 23.4% |
| Immigrants | Germany | 42.5 /100 | #184 | Average 23.4% |
| Haitians | 42.4 /100 | #185 | Average 23.4% |
| Basques | 38.4 /100 | #186 | Fair 23.5% |
| Portuguese | 37.8 /100 | #187 | Fair 23.5% |
| Immigrants | Cuba | 34.0 /100 | #188 | Fair 23.6% |
| Scottish | 33.1 /100 | #189 | Fair 23.6% |
Demographics Similar to Cajuns by Disability Age 65 to 74
In terms of disability age 65 to 74, the demographic groups most similar to Cajuns are Crow (27.9%, a difference of 0.040%), Immigrants from Armenia (28.0%, a difference of 0.13%), Nepalese (28.0%, a difference of 0.35%), Chippewa (27.8%, a difference of 0.47%), and Paiute (27.8%, a difference of 0.48%).
| Demographics | Rating | Rank | Disability Age 65 to 74 |
| Sioux | 0.0 /100 | #308 | Tragic 27.3% |
| Yaqui | 0.0 /100 | #309 | Tragic 27.4% |
| Shoshone | 0.0 /100 | #310 | Tragic 27.4% |
| Menominee | 0.0 /100 | #311 | Tragic 27.4% |
| Osage | 0.0 /100 | #312 | Tragic 27.5% |
| Paiute | 0.0 /100 | #313 | Tragic 27.8% |
| Chippewa | 0.0 /100 | #314 | Tragic 27.8% |
| Cajuns | 0.0 /100 | #315 | Tragic 27.9% |
| Crow | 0.0 /100 | #316 | Tragic 27.9% |
| Immigrants | Armenia | 0.0 /100 | #317 | Tragic 28.0% |
| Nepalese | 0.0 /100 | #318 | Tragic 28.0% |
| Arapaho | 0.0 /100 | #319 | Tragic 28.1% |
| Cherokee | 0.0 /100 | #320 | Tragic 28.2% |
| Comanche | 0.0 /100 | #321 | Tragic 28.3% |
| Aleuts | 0.0 /100 | #322 | Tragic 28.4% |