Japanese vs Iraqi Male Disability
COMPARE
Japanese
Iraqi
Male Disability
Male Disability Comparison
Japanese
Iraqis
11.7%
MALE DISABILITY
3.1/ 100
METRIC RATING
224th/ 347
METRIC RANK
11.3%
MALE DISABILITY
30.5/ 100
METRIC RATING
184th/ 347
METRIC RANK
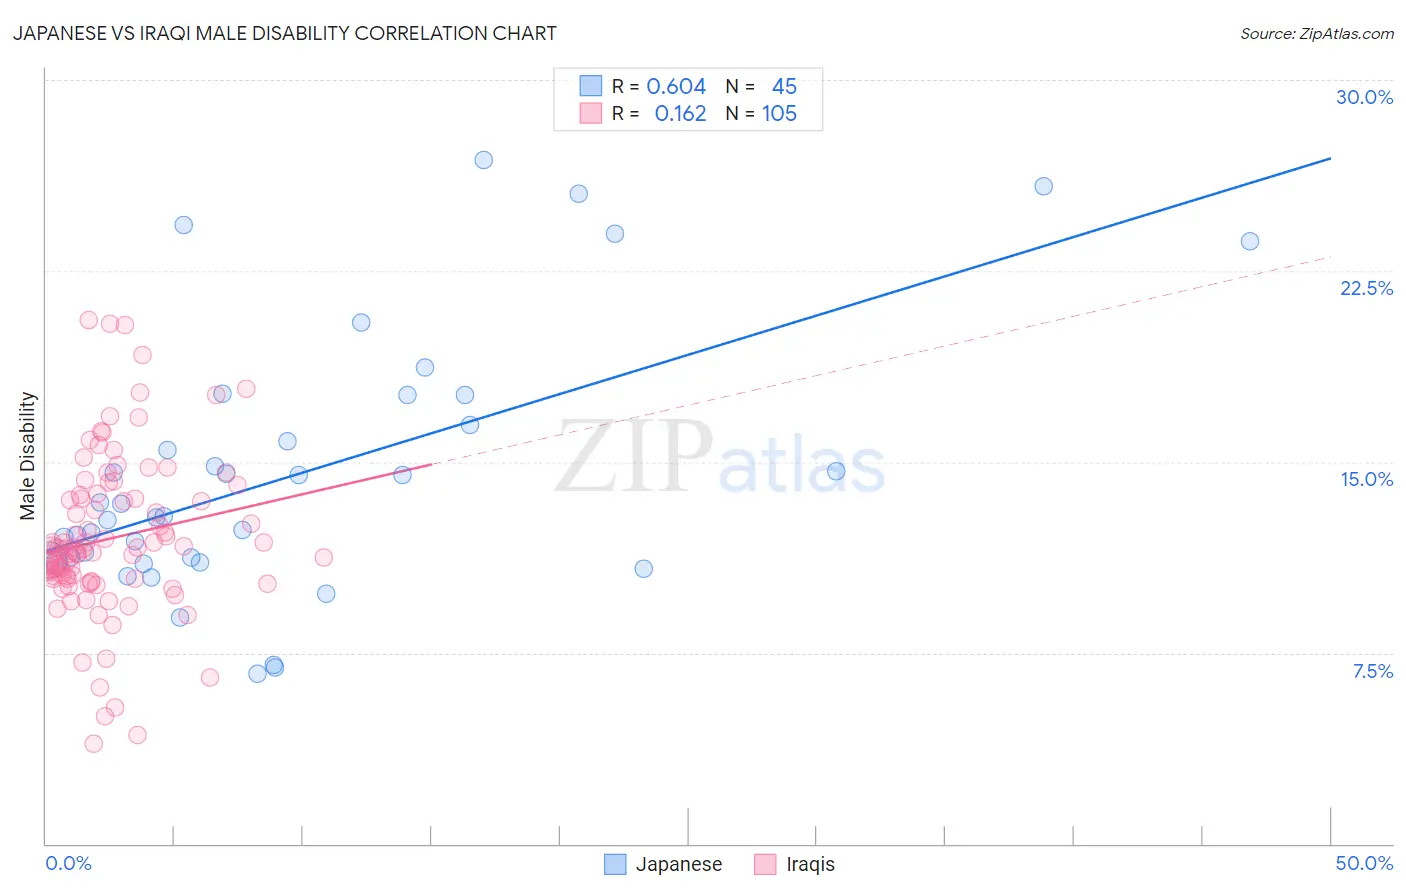
Japanese vs Iraqi Male Disability Correlation Chart
The statistical analysis conducted on geographies consisting of 249,159,975 people shows a significant positive correlation between the proportion of Japanese and percentage of males with a disability in the United States with a correlation coefficient (R) of 0.604 and weighted average of 11.7%. Similarly, the statistical analysis conducted on geographies consisting of 170,656,152 people shows a poor positive correlation between the proportion of Iraqis and percentage of males with a disability in the United States with a correlation coefficient (R) of 0.162 and weighted average of 11.3%, a difference of 3.6%.
Male Disability Correlation Summary
| Measurement | Japanese | Iraqi |
| Minimum | 6.7% | 3.9% |
| Maximum | 26.9% | 20.6% |
| Range | 20.2% | 16.7% |
| Mean | 14.5% | 12.0% |
| Median | 12.9% | 11.6% |
| Interquartile 25% (IQ1) | 11.1% | 10.4% |
| Interquartile 75% (IQ3) | 17.0% | 13.6% |
| Interquartile Range (IQR) | 5.9% | 3.2% |
| Standard Deviation (Sample) | 5.1% | 3.1% |
| Standard Deviation (Population) | 5.1% | 3.1% |
Similar Demographics by Male Disability
Demographics Similar to Japanese by Male Disability
In terms of male disability, the demographic groups most similar to Japanese are Liberian (11.8%, a difference of 0.010%), Immigrants from Bahamas (11.7%, a difference of 0.020%), Alsatian (11.7%, a difference of 0.11%), Subsaharan African (11.8%, a difference of 0.13%), and Immigrants from Congo (11.7%, a difference of 0.26%).
| Demographics | Rating | Rank | Male Disability |
| Immigrants | Dominica | 4.6 /100 | #217 | Tragic 11.7% |
| Immigrants | England | 4.0 /100 | #218 | Tragic 11.7% |
| Panamanians | 3.8 /100 | #219 | Tragic 11.7% |
| Immigrants | Western Europe | 3.8 /100 | #220 | Tragic 11.7% |
| Immigrants | Congo | 3.7 /100 | #221 | Tragic 11.7% |
| Alsatians | 3.3 /100 | #222 | Tragic 11.7% |
| Immigrants | Bahamas | 3.2 /100 | #223 | Tragic 11.7% |
| Japanese | 3.1 /100 | #224 | Tragic 11.7% |
| Liberians | 3.1 /100 | #225 | Tragic 11.8% |
| Sub-Saharan Africans | 2.8 /100 | #226 | Tragic 11.8% |
| Austrians | 2.5 /100 | #227 | Tragic 11.8% |
| Hispanics or Latinos | 2.3 /100 | #228 | Tragic 11.8% |
| Bermudans | 2.3 /100 | #229 | Tragic 11.8% |
| Croatians | 2.1 /100 | #230 | Tragic 11.8% |
| Dominicans | 1.8 /100 | #231 | Tragic 11.8% |
Demographics Similar to Iraqis by Male Disability
In terms of male disability, the demographic groups most similar to Iraqis are Pakistani (11.3%, a difference of 0.010%), Immigrants from Central America (11.3%, a difference of 0.15%), Immigrants from Zaire (11.4%, a difference of 0.19%), Immigrants from Belize (11.3%, a difference of 0.20%), and Immigrants from Austria (11.4%, a difference of 0.21%).
| Demographics | Rating | Rank | Male Disability |
| Immigrants | Norway | 44.2 /100 | #177 | Average 11.3% |
| Australians | 42.2 /100 | #178 | Average 11.3% |
| Immigrants | Caribbean | 41.4 /100 | #179 | Average 11.3% |
| Hondurans | 41.1 /100 | #180 | Average 11.3% |
| Immigrants | Senegal | 34.4 /100 | #181 | Fair 11.3% |
| Immigrants | Belize | 33.7 /100 | #182 | Fair 11.3% |
| Immigrants | Central America | 32.9 /100 | #183 | Fair 11.3% |
| Iraqis | 30.5 /100 | #184 | Fair 11.3% |
| Pakistanis | 30.3 /100 | #185 | Fair 11.3% |
| Immigrants | Zaire | 27.6 /100 | #186 | Fair 11.4% |
| Immigrants | Austria | 27.3 /100 | #187 | Fair 11.4% |
| Estonians | 26.8 /100 | #188 | Fair 11.4% |
| Immigrants | Netherlands | 25.9 /100 | #189 | Fair 11.4% |
| Immigrants | Bosnia and Herzegovina | 25.4 /100 | #190 | Fair 11.4% |
| Senegalese | 23.2 /100 | #191 | Fair 11.4% |