Menominee vs Fijian Cognitive Disability
COMPARE
Menominee
Fijian
Cognitive Disability
Cognitive Disability Comparison
Menominee
Fijians
18.0%
COGNITIVE DISABILITY
0.4/ 100
METRIC RATING
264th/ 347
METRIC RANK
17.7%
COGNITIVE DISABILITY
3.4/ 100
METRIC RATING
224th/ 347
METRIC RANK
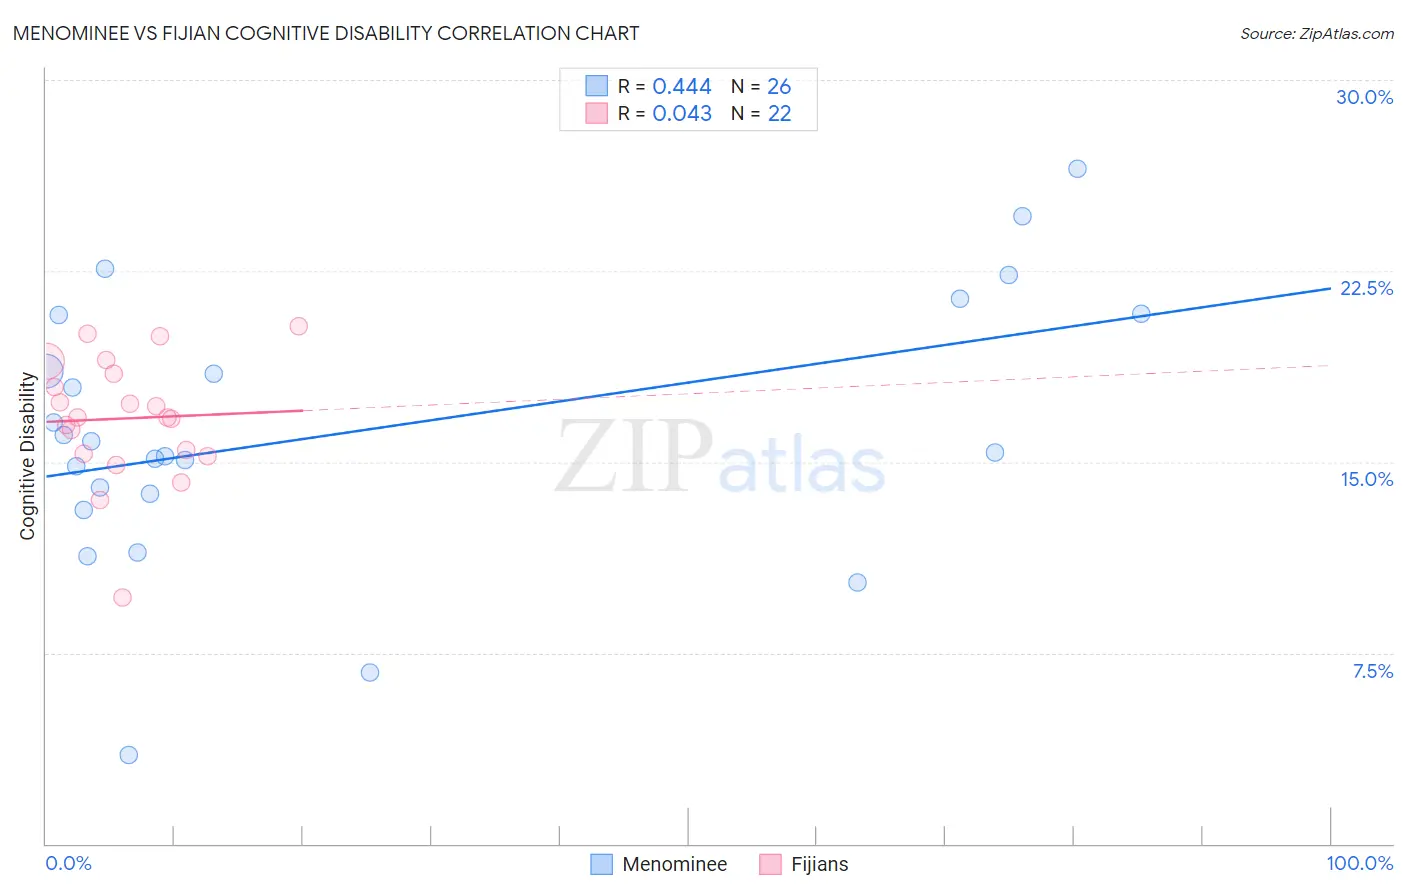
Menominee vs Fijian Cognitive Disability Correlation Chart
The statistical analysis conducted on geographies consisting of 45,777,849 people shows a moderate positive correlation between the proportion of Menominee and percentage of population with cognitive disability in the United States with a correlation coefficient (R) of 0.444 and weighted average of 18.0%. Similarly, the statistical analysis conducted on geographies consisting of 55,934,490 people shows no correlation between the proportion of Fijians and percentage of population with cognitive disability in the United States with a correlation coefficient (R) of 0.043 and weighted average of 17.7%, a difference of 1.5%.
Cognitive Disability Correlation Summary
| Measurement | Menominee | Fijian |
| Minimum | 3.5% | 9.7% |
| Maximum | 26.5% | 20.3% |
| Range | 23.0% | 10.6% |
| Mean | 16.2% | 16.7% |
| Median | 15.6% | 16.7% |
| Interquartile 25% (IQ1) | 13.7% | 15.3% |
| Interquartile 75% (IQ3) | 20.8% | 18.4% |
| Interquartile Range (IQR) | 7.0% | 3.1% |
| Standard Deviation (Sample) | 5.3% | 2.4% |
| Standard Deviation (Population) | 5.2% | 2.4% |
Similar Demographics by Cognitive Disability
Demographics Similar to Menominee by Cognitive Disability
In terms of cognitive disability, the demographic groups most similar to Menominee are Spanish American (18.0%, a difference of 0.030%), Belizean (18.0%, a difference of 0.030%), Immigrants from Barbados (17.9%, a difference of 0.060%), Nepalese (18.0%, a difference of 0.090%), and Sierra Leonean (17.9%, a difference of 0.10%).
| Demographics | Rating | Rank | Cognitive Disability |
| Mexican American Indians | 0.6 /100 | #257 | Tragic 17.9% |
| Immigrants | Armenia | 0.6 /100 | #258 | Tragic 17.9% |
| Ethiopians | 0.5 /100 | #259 | Tragic 17.9% |
| Immigrants | Belize | 0.5 /100 | #260 | Tragic 17.9% |
| Guamanians/Chamorros | 0.5 /100 | #261 | Tragic 17.9% |
| Sierra Leoneans | 0.4 /100 | #262 | Tragic 17.9% |
| Immigrants | Barbados | 0.4 /100 | #263 | Tragic 17.9% |
| Menominee | 0.4 /100 | #264 | Tragic 18.0% |
| Spanish Americans | 0.4 /100 | #265 | Tragic 18.0% |
| Belizeans | 0.4 /100 | #266 | Tragic 18.0% |
| Nepalese | 0.3 /100 | #267 | Tragic 18.0% |
| Cherokee | 0.3 /100 | #268 | Tragic 18.0% |
| Hondurans | 0.3 /100 | #269 | Tragic 18.0% |
| Immigrants | Bahamas | 0.3 /100 | #270 | Tragic 18.0% |
| Potawatomi | 0.2 /100 | #271 | Tragic 18.0% |
Demographics Similar to Fijians by Cognitive Disability
In terms of cognitive disability, the demographic groups most similar to Fijians are Vietnamese (17.7%, a difference of 0.010%), Marshallese (17.7%, a difference of 0.17%), Alsatian (17.7%, a difference of 0.19%), Central American (17.7%, a difference of 0.20%), and Immigrants from St. Vincent and the Grenadines (17.7%, a difference of 0.20%).
| Demographics | Rating | Rank | Cognitive Disability |
| Salvadorans | 6.7 /100 | #217 | Tragic 17.6% |
| Icelanders | 6.4 /100 | #218 | Tragic 17.6% |
| Immigrants | Sierra Leone | 6.3 /100 | #219 | Tragic 17.6% |
| Zimbabweans | 6.1 /100 | #220 | Tragic 17.6% |
| Moroccans | 5.9 /100 | #221 | Tragic 17.6% |
| Central Americans | 4.5 /100 | #222 | Tragic 17.7% |
| Alsatians | 4.5 /100 | #223 | Tragic 17.7% |
| Fijians | 3.4 /100 | #224 | Tragic 17.7% |
| Vietnamese | 3.4 /100 | #225 | Tragic 17.7% |
| Marshallese | 2.7 /100 | #226 | Tragic 17.7% |
| Immigrants | St. Vincent and the Grenadines | 2.6 /100 | #227 | Tragic 17.7% |
| Immigrants | Central America | 2.3 /100 | #228 | Tragic 17.7% |
| Immigrants | Guatemala | 2.2 /100 | #229 | Tragic 17.7% |
| Mongolians | 2.2 /100 | #230 | Tragic 17.7% |
| Guatemalans | 2.1 /100 | #231 | Tragic 17.8% |