Native/Alaskan vs Immigrants from Belarus Disability
COMPARE
Native/Alaskan
Immigrants from Belarus
Disability
Disability Comparison
Natives/Alaskans
Immigrants from Belarus
14.2%
DISABILITY
0.0/ 100
METRIC RATING
325th/ 347
METRIC RANK
11.1%
DISABILITY
98.9/ 100
METRIC RATING
85th/ 347
METRIC RANK
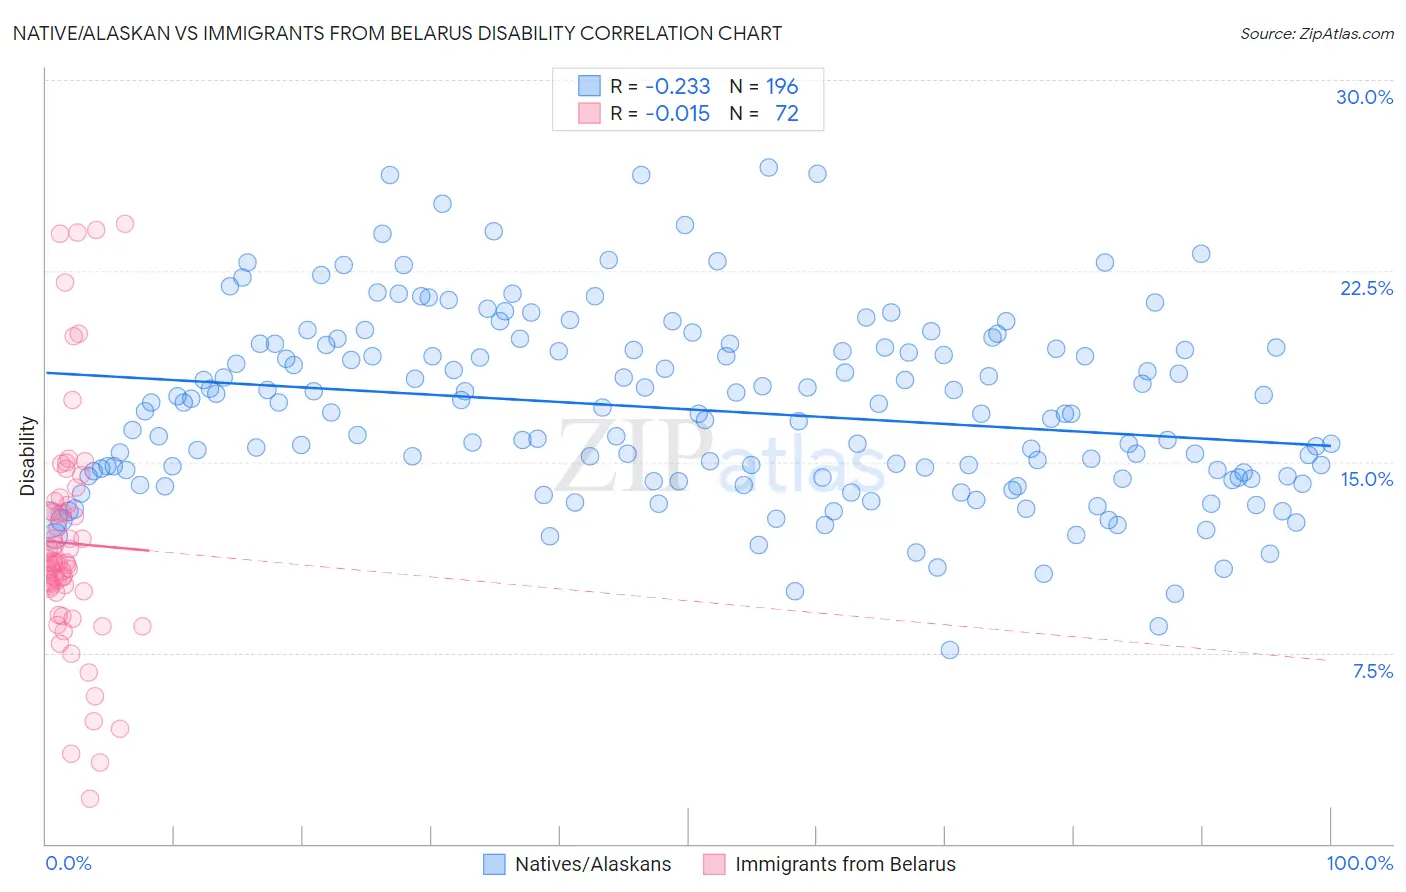
Native/Alaskan vs Immigrants from Belarus Disability Correlation Chart
The statistical analysis conducted on geographies consisting of 512,916,136 people shows a weak negative correlation between the proportion of Natives/Alaskans and percentage of population with a disability in the United States with a correlation coefficient (R) of -0.233 and weighted average of 14.2%. Similarly, the statistical analysis conducted on geographies consisting of 150,193,731 people shows no correlation between the proportion of Immigrants from Belarus and percentage of population with a disability in the United States with a correlation coefficient (R) of -0.015 and weighted average of 11.1%, a difference of 27.3%.
Disability Correlation Summary
| Measurement | Native/Alaskan | Immigrants from Belarus |
| Minimum | 7.6% | 1.8% |
| Maximum | 26.5% | 24.3% |
| Range | 18.9% | 22.6% |
| Mean | 17.1% | 11.8% |
| Median | 16.9% | 11.0% |
| Interquartile 25% (IQ1) | 14.4% | 10.0% |
| Interquartile 75% (IQ3) | 19.5% | 13.2% |
| Interquartile Range (IQR) | 5.1% | 3.2% |
| Standard Deviation (Sample) | 3.6% | 4.6% |
| Standard Deviation (Population) | 3.6% | 4.6% |
Similar Demographics by Disability
Demographics Similar to Natives/Alaskans by Disability
In terms of disability, the demographic groups most similar to Natives/Alaskans are Osage (14.2%, a difference of 0.030%), Chippewa (14.1%, a difference of 0.050%), Ottawa (14.2%, a difference of 0.060%), Immigrants from the Azores (14.2%, a difference of 0.060%), and Potawatomi (14.2%, a difference of 0.17%).
| Demographics | Rating | Rank | Disability |
| Menominee | 0.0 /100 | #318 | Tragic 13.8% |
| Iroquois | 0.0 /100 | #319 | Tragic 13.8% |
| Apache | 0.0 /100 | #320 | Tragic 13.9% |
| Paiute | 0.0 /100 | #321 | Tragic 13.9% |
| Americans | 0.0 /100 | #322 | Tragic 13.9% |
| Comanche | 0.0 /100 | #323 | Tragic 14.1% |
| Chippewa | 0.0 /100 | #324 | Tragic 14.1% |
| Natives/Alaskans | 0.0 /100 | #325 | Tragic 14.2% |
| Osage | 0.0 /100 | #326 | Tragic 14.2% |
| Ottawa | 0.0 /100 | #327 | Tragic 14.2% |
| Immigrants | Azores | 0.0 /100 | #328 | Tragic 14.2% |
| Potawatomi | 0.0 /100 | #329 | Tragic 14.2% |
| Navajo | 0.0 /100 | #330 | Tragic 14.3% |
| Alaskan Athabascans | 0.0 /100 | #331 | Tragic 14.4% |
| Pueblo | 0.0 /100 | #332 | Tragic 14.4% |
Demographics Similar to Immigrants from Belarus by Disability
In terms of disability, the demographic groups most similar to Immigrants from Belarus are Immigrants from Russia (11.1%, a difference of 0.0%), Palestinian (11.1%, a difference of 0.040%), Immigrants from Sierra Leone (11.1%, a difference of 0.15%), Immigrants from Switzerland (11.1%, a difference of 0.16%), and Chilean (11.1%, a difference of 0.19%).
| Demographics | Rating | Rank | Disability |
| Immigrants | Cameroon | 99.3 /100 | #78 | Exceptional 11.1% |
| Immigrants | Jordan | 99.3 /100 | #79 | Exceptional 11.1% |
| Immigrants | Ireland | 99.3 /100 | #80 | Exceptional 11.1% |
| Immigrants | Poland | 99.1 /100 | #81 | Exceptional 11.1% |
| Chileans | 99.1 /100 | #82 | Exceptional 11.1% |
| Immigrants | Switzerland | 99.0 /100 | #83 | Exceptional 11.1% |
| Immigrants | Sierra Leone | 99.0 /100 | #84 | Exceptional 11.1% |
| Immigrants | Belarus | 98.9 /100 | #85 | Exceptional 11.1% |
| Immigrants | Russia | 98.9 /100 | #86 | Exceptional 11.1% |
| Palestinians | 98.9 /100 | #87 | Exceptional 11.1% |
| Immigrants | Romania | 98.5 /100 | #88 | Exceptional 11.2% |
| Immigrants | South Africa | 98.2 /100 | #89 | Exceptional 11.2% |
| Immigrants | Brazil | 98.1 /100 | #90 | Exceptional 11.2% |
| Immigrants | Western Asia | 98.1 /100 | #91 | Exceptional 11.2% |
| Ecuadorians | 98.0 /100 | #92 | Exceptional 11.2% |