Northern European vs Colville Ambulatory Disability
COMPARE
Northern European
Colville
Ambulatory Disability
Ambulatory Disability Comparison
Northern Europeans
Colville
6.0%
AMBULATORY DISABILITY
71.8/ 100
METRIC RATING
156th/ 347
METRIC RANK
8.2%
AMBULATORY DISABILITY
0.0/ 100
METRIC RATING
338th/ 347
METRIC RANK
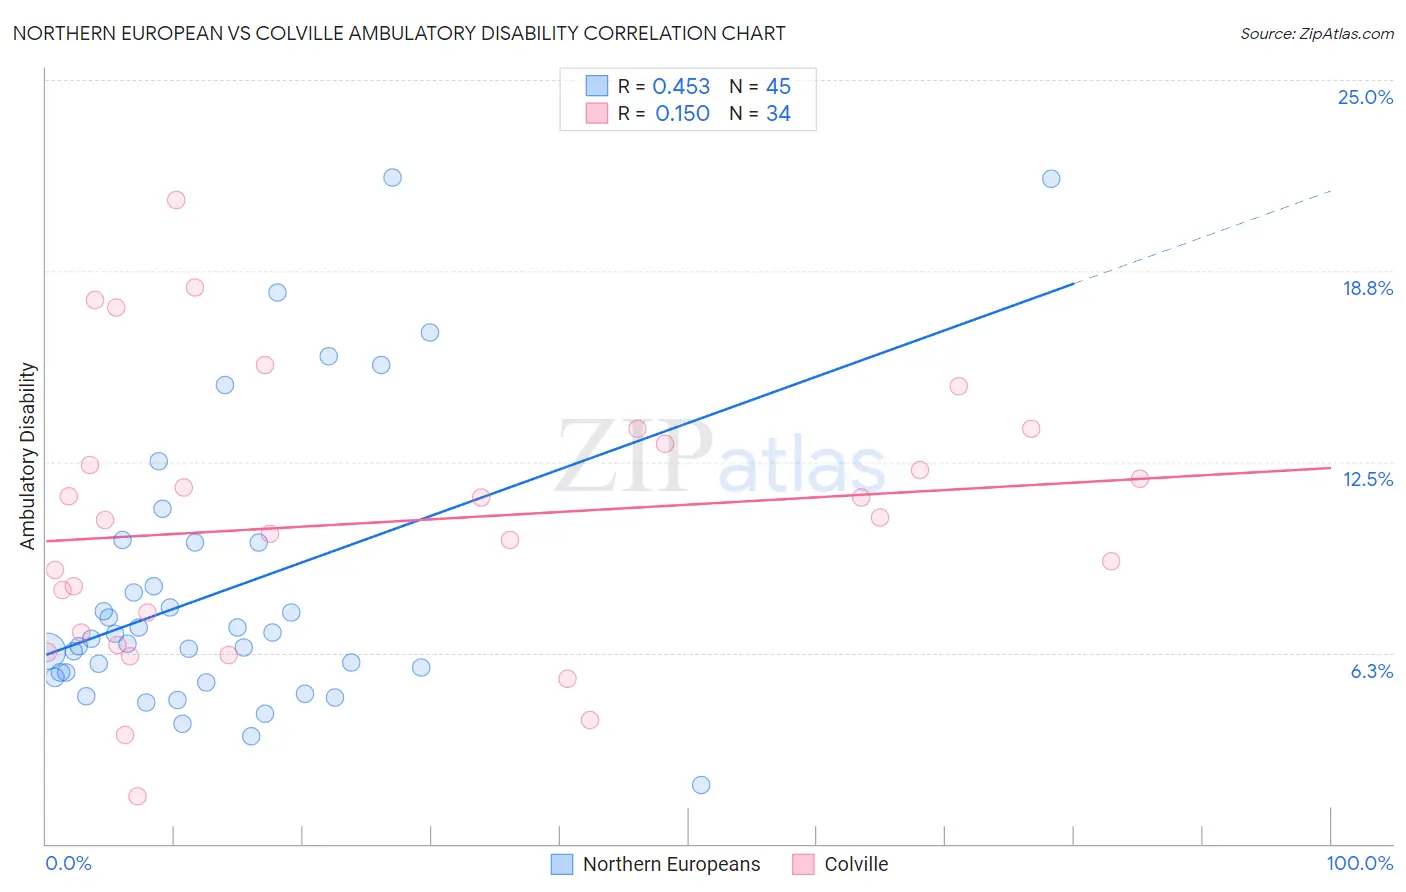
Northern European vs Colville Ambulatory Disability Correlation Chart
The statistical analysis conducted on geographies consisting of 405,984,398 people shows a moderate positive correlation between the proportion of Northern Europeans and percentage of population with ambulatory disability in the United States with a correlation coefficient (R) of 0.453 and weighted average of 6.0%. Similarly, the statistical analysis conducted on geographies consisting of 34,678,194 people shows a poor positive correlation between the proportion of Colville and percentage of population with ambulatory disability in the United States with a correlation coefficient (R) of 0.150 and weighted average of 8.2%, a difference of 36.0%.
Ambulatory Disability Correlation Summary
| Measurement | Northern European | Colville |
| Minimum | 1.9% | 1.6% |
| Maximum | 21.8% | 21.1% |
| Range | 19.9% | 19.5% |
| Mean | 8.3% | 10.5% |
| Median | 6.7% | 10.6% |
| Interquartile 25% (IQ1) | 5.5% | 6.9% |
| Interquartile 75% (IQ3) | 9.9% | 13.1% |
| Interquartile Range (IQR) | 4.3% | 6.2% |
| Standard Deviation (Sample) | 4.7% | 4.5% |
| Standard Deviation (Population) | 4.6% | 4.4% |
Similar Demographics by Ambulatory Disability
Demographics Similar to Northern Europeans by Ambulatory Disability
In terms of ambulatory disability, the demographic groups most similar to Northern Europeans are Immigrants from Scotland (6.0%, a difference of 0.020%), Ghanaian (6.0%, a difference of 0.030%), Immigrants from Fiji (6.0%, a difference of 0.050%), Immigrants from Latvia (6.0%, a difference of 0.050%), and Central American (6.0%, a difference of 0.13%).
| Demographics | Rating | Rank | Ambulatory Disability |
| Lithuanians | 81.9 /100 | #149 | Excellent 6.0% |
| Maltese | 81.6 /100 | #150 | Excellent 6.0% |
| Greeks | 79.6 /100 | #151 | Good 6.0% |
| Immigrants | Austria | 78.8 /100 | #152 | Good 6.0% |
| Syrians | 75.5 /100 | #153 | Good 6.0% |
| Immigrants | Croatia | 75.1 /100 | #154 | Good 6.0% |
| Immigrants | Scotland | 72.1 /100 | #155 | Good 6.0% |
| Northern Europeans | 71.8 /100 | #156 | Good 6.0% |
| Ghanaians | 71.3 /100 | #157 | Good 6.0% |
| Immigrants | Fiji | 71.2 /100 | #158 | Good 6.0% |
| Immigrants | Latvia | 71.1 /100 | #159 | Good 6.0% |
| Central Americans | 69.8 /100 | #160 | Good 6.0% |
| Immigrants | Belarus | 69.2 /100 | #161 | Good 6.1% |
| Nigerians | 67.1 /100 | #162 | Good 6.1% |
| Lebanese | 66.2 /100 | #163 | Good 6.1% |
Demographics Similar to Colville by Ambulatory Disability
In terms of ambulatory disability, the demographic groups most similar to Colville are Pima (8.2%, a difference of 0.35%), Dutch West Indian (8.2%, a difference of 0.57%), Choctaw (8.3%, a difference of 1.2%), Seminole (8.0%, a difference of 2.2%), and Chickasaw (8.0%, a difference of 2.3%).
| Demographics | Rating | Rank | Ambulatory Disability |
| Cajuns | 0.0 /100 | #331 | Tragic 7.8% |
| Menominee | 0.0 /100 | #332 | Tragic 7.8% |
| Cherokee | 0.0 /100 | #333 | Tragic 7.9% |
| Yuman | 0.0 /100 | #334 | Tragic 7.9% |
| Chickasaw | 0.0 /100 | #335 | Tragic 8.0% |
| Seminole | 0.0 /100 | #336 | Tragic 8.0% |
| Dutch West Indians | 0.0 /100 | #337 | Tragic 8.2% |
| Colville | 0.0 /100 | #338 | Tragic 8.2% |
| Pima | 0.0 /100 | #339 | Tragic 8.2% |
| Choctaw | 0.0 /100 | #340 | Tragic 8.3% |
| Creek | 0.0 /100 | #341 | Tragic 8.5% |
| Kiowa | 0.0 /100 | #342 | Tragic 8.6% |
| Tohono O'odham | 0.0 /100 | #343 | Tragic 8.7% |
| Tsimshian | 0.0 /100 | #344 | Tragic 8.8% |
| Puerto Ricans | 0.0 /100 | #345 | Tragic 8.9% |