Paiute vs Latvian Cognitive Disability
COMPARE
Paiute
Latvian
Cognitive Disability
Cognitive Disability Comparison
Paiute
Latvians
17.8%
COGNITIVE DISABILITY
1.1/ 100
METRIC RATING
242nd/ 347
METRIC RANK
16.6%
COGNITIVE DISABILITY
99.5/ 100
METRIC RATING
67th/ 347
METRIC RANK
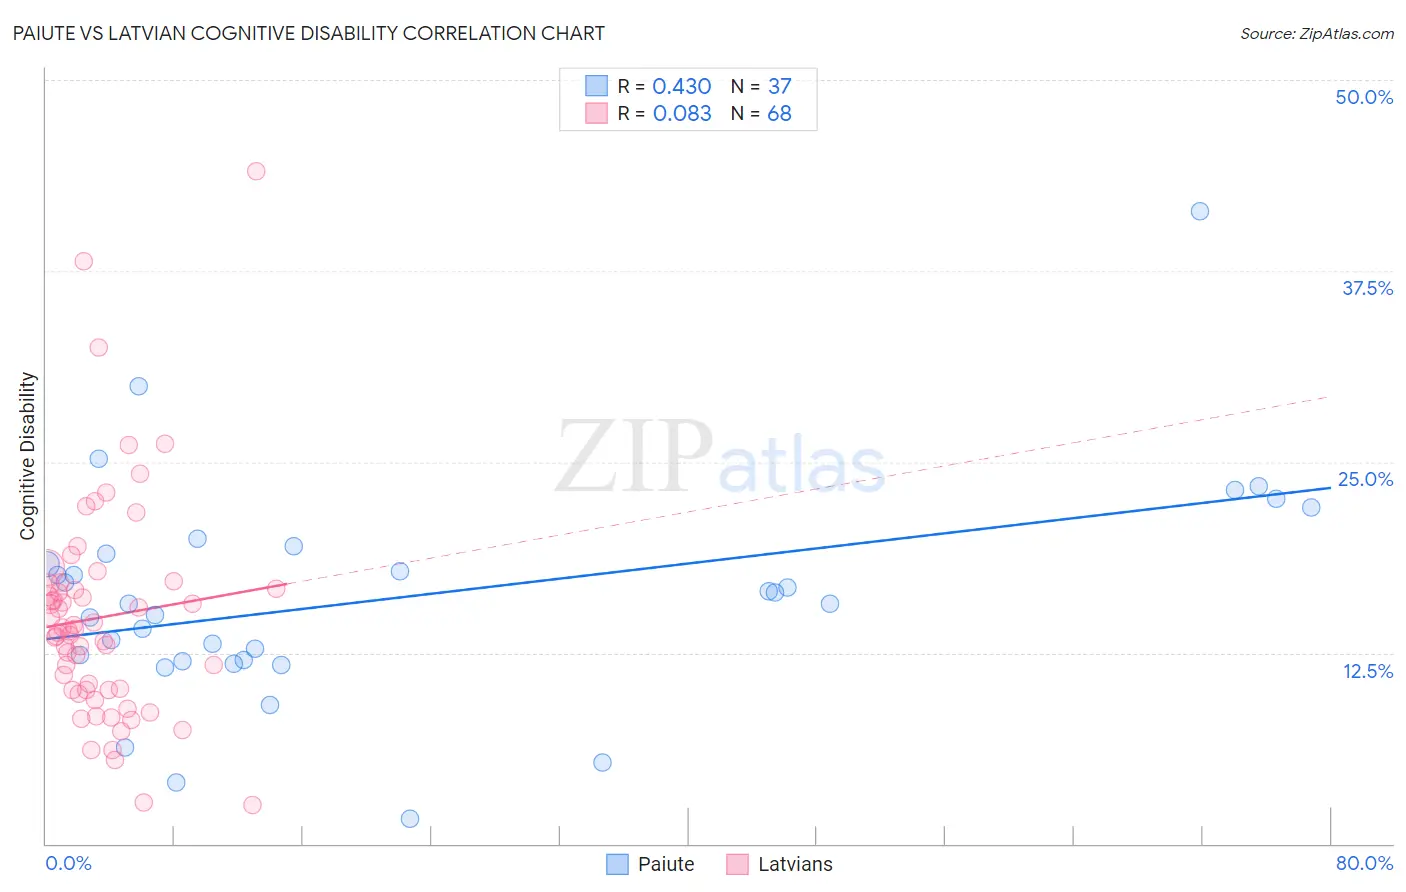
Paiute vs Latvian Cognitive Disability Correlation Chart
The statistical analysis conducted on geographies consisting of 58,394,773 people shows a moderate positive correlation between the proportion of Paiute and percentage of population with cognitive disability in the United States with a correlation coefficient (R) of 0.430 and weighted average of 17.8%. Similarly, the statistical analysis conducted on geographies consisting of 220,719,023 people shows a slight positive correlation between the proportion of Latvians and percentage of population with cognitive disability in the United States with a correlation coefficient (R) of 0.083 and weighted average of 16.6%, a difference of 7.2%.
Cognitive Disability Correlation Summary
| Measurement | Paiute | Latvian |
| Minimum | 1.6% | 2.6% |
| Maximum | 41.4% | 44.0% |
| Range | 39.8% | 41.5% |
| Mean | 16.1% | 14.8% |
| Median | 15.8% | 14.0% |
| Interquartile 25% (IQ1) | 12.0% | 10.1% |
| Interquartile 75% (IQ3) | 19.2% | 16.8% |
| Interquartile Range (IQR) | 7.2% | 6.7% |
| Standard Deviation (Sample) | 7.3% | 7.2% |
| Standard Deviation (Population) | 7.2% | 7.2% |
Similar Demographics by Cognitive Disability
Demographics Similar to Paiute by Cognitive Disability
In terms of cognitive disability, the demographic groups most similar to Paiute are Mexican (17.8%, a difference of 0.020%), Immigrants from Bangladesh (17.8%, a difference of 0.070%), Jamaican (17.9%, a difference of 0.11%), Iraqi (17.8%, a difference of 0.16%), and Cajun (17.8%, a difference of 0.19%).
| Demographics | Rating | Rank | Cognitive Disability |
| Spanish American Indians | 2.0 /100 | #235 | Tragic 17.8% |
| Immigrants | Iraq | 1.8 /100 | #236 | Tragic 17.8% |
| Immigrants | Mexico | 1.8 /100 | #237 | Tragic 17.8% |
| Cheyenne | 1.7 /100 | #238 | Tragic 17.8% |
| Cajuns | 1.4 /100 | #239 | Tragic 17.8% |
| Iraqis | 1.4 /100 | #240 | Tragic 17.8% |
| Mexicans | 1.1 /100 | #241 | Tragic 17.8% |
| Paiute | 1.1 /100 | #242 | Tragic 17.8% |
| Immigrants | Bangladesh | 1.0 /100 | #243 | Tragic 17.8% |
| Jamaicans | 0.9 /100 | #244 | Tragic 17.9% |
| Trinidadians and Tobagonians | 0.8 /100 | #245 | Tragic 17.9% |
| Immigrants | Thailand | 0.8 /100 | #246 | Tragic 17.9% |
| Samoans | 0.7 /100 | #247 | Tragic 17.9% |
| French American Indians | 0.7 /100 | #248 | Tragic 17.9% |
| Cree | 0.7 /100 | #249 | Tragic 17.9% |
Demographics Similar to Latvians by Cognitive Disability
In terms of cognitive disability, the demographic groups most similar to Latvians are Immigrants from Ukraine (16.6%, a difference of 0.040%), Ukrainian (16.6%, a difference of 0.040%), Immigrants from Uzbekistan (16.7%, a difference of 0.12%), Immigrants from Sweden (16.7%, a difference of 0.13%), and Immigrants from Belgium (16.7%, a difference of 0.14%).
| Demographics | Rating | Rank | Cognitive Disability |
| Romanians | 99.7 /100 | #60 | Exceptional 16.6% |
| Immigrants | England | 99.6 /100 | #61 | Exceptional 16.6% |
| Czechoslovakians | 99.6 /100 | #62 | Exceptional 16.6% |
| Argentineans | 99.6 /100 | #63 | Exceptional 16.6% |
| Venezuelans | 99.6 /100 | #64 | Exceptional 16.6% |
| Colombians | 99.6 /100 | #65 | Exceptional 16.6% |
| Immigrants | Ukraine | 99.5 /100 | #66 | Exceptional 16.6% |
| Latvians | 99.5 /100 | #67 | Exceptional 16.6% |
| Ukrainians | 99.4 /100 | #68 | Exceptional 16.6% |
| Immigrants | Uzbekistan | 99.4 /100 | #69 | Exceptional 16.7% |
| Immigrants | Sweden | 99.4 /100 | #70 | Exceptional 16.7% |
| Immigrants | Belgium | 99.3 /100 | #71 | Exceptional 16.7% |
| Germans | 99.3 /100 | #72 | Exceptional 16.7% |
| Burmese | 99.3 /100 | #73 | Exceptional 16.7% |
| Slavs | 99.3 /100 | #74 | Exceptional 16.7% |