Pakistani vs Immigrants from Italy Disability Age 65 to 74
COMPARE
Pakistani
Immigrants from Italy
Disability Age 65 to 74
Disability Age 65 to 74 Comparison
Pakistanis
Immigrants from Italy
23.2%
DISABILITY AGE 65 TO 74
57.0/ 100
METRIC RATING
168th/ 347
METRIC RANK
21.5%
DISABILITY AGE 65 TO 74
99.6/ 100
METRIC RATING
54th/ 347
METRIC RANK
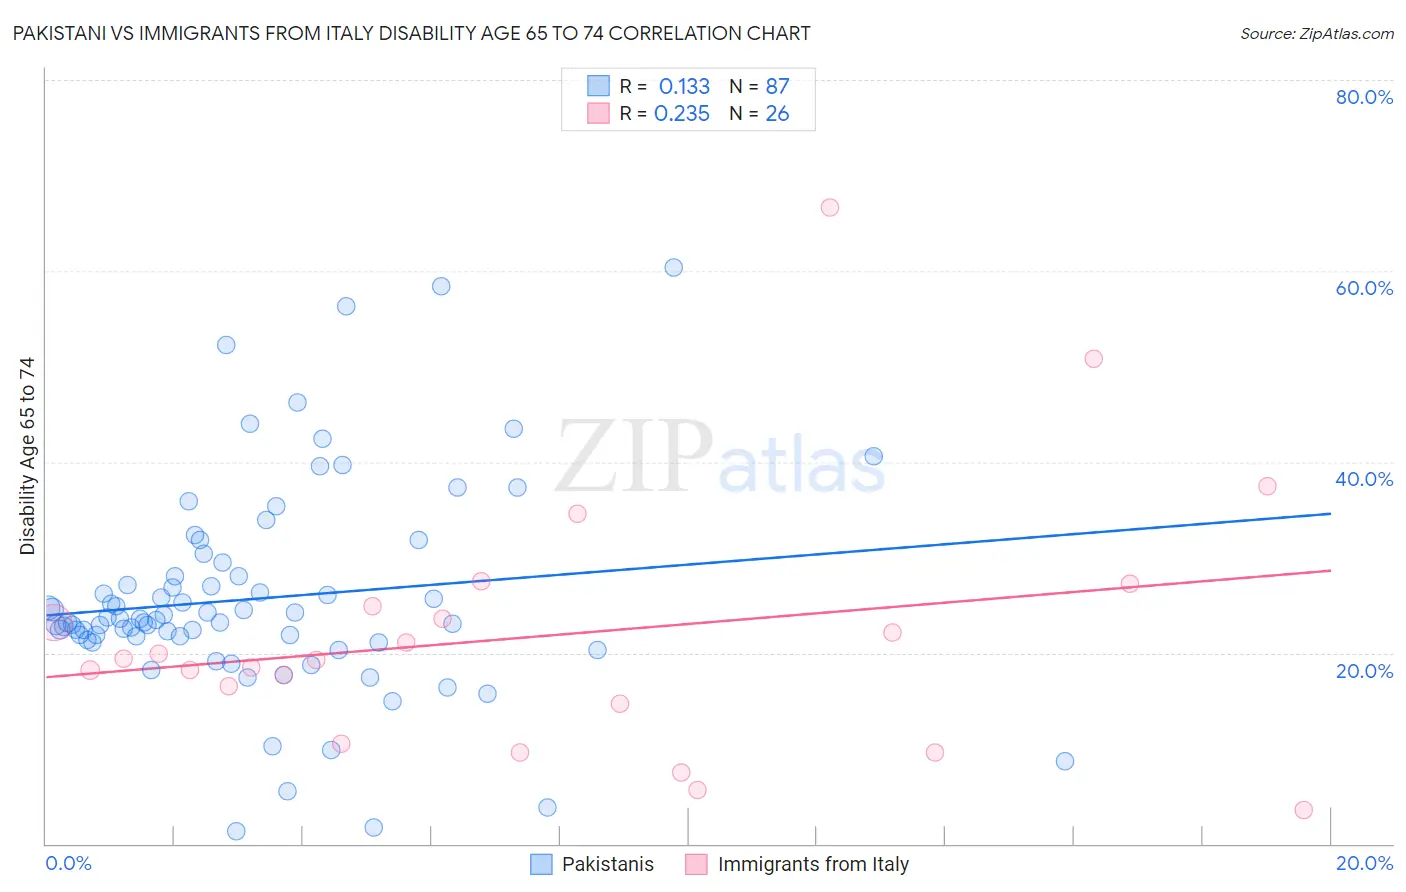
Pakistani vs Immigrants from Italy Disability Age 65 to 74 Correlation Chart
The statistical analysis conducted on geographies consisting of 334,780,932 people shows a poor positive correlation between the proportion of Pakistanis and percentage of population with a disability between the ages 65 and 75 in the United States with a correlation coefficient (R) of 0.133 and weighted average of 23.2%. Similarly, the statistical analysis conducted on geographies consisting of 323,882,260 people shows a weak positive correlation between the proportion of Immigrants from Italy and percentage of population with a disability between the ages 65 and 75 in the United States with a correlation coefficient (R) of 0.235 and weighted average of 21.5%, a difference of 8.1%.
Disability Age 65 to 74 Correlation Summary
| Measurement | Pakistani | Immigrants from Italy |
| Minimum | 1.3% | 3.5% |
| Maximum | 60.4% | 66.7% |
| Range | 59.1% | 63.2% |
| Mean | 25.7% | 21.8% |
| Median | 23.4% | 19.3% |
| Interquartile 25% (IQ1) | 21.4% | 14.7% |
| Interquartile 75% (IQ3) | 28.1% | 24.9% |
| Interquartile Range (IQR) | 6.7% | 10.2% |
| Standard Deviation (Sample) | 11.0% | 13.7% |
| Standard Deviation (Population) | 11.0% | 13.5% |
Similar Demographics by Disability Age 65 to 74
Demographics Similar to Pakistanis by Disability Age 65 to 74
In terms of disability age 65 to 74, the demographic groups most similar to Pakistanis are Immigrants from Bosnia and Herzegovina (23.2%, a difference of 0.040%), Icelander (23.3%, a difference of 0.16%), Moroccan (23.3%, a difference of 0.16%), Immigrants from Afghanistan (23.2%, a difference of 0.22%), and Vietnamese (23.2%, a difference of 0.23%).
| Demographics | Rating | Rank | Disability Age 65 to 74 |
| Immigrants | Cameroon | 63.8 /100 | #161 | Good 23.1% |
| Europeans | 61.2 /100 | #162 | Good 23.2% |
| Immigrants | Philippines | 61.1 /100 | #163 | Good 23.2% |
| Sierra Leoneans | 60.9 /100 | #164 | Good 23.2% |
| Vietnamese | 60.8 /100 | #165 | Good 23.2% |
| Immigrants | Afghanistan | 60.5 /100 | #166 | Good 23.2% |
| Immigrants | Bosnia and Herzegovina | 57.6 /100 | #167 | Average 23.2% |
| Pakistanis | 57.0 /100 | #168 | Average 23.2% |
| Icelanders | 54.3 /100 | #169 | Average 23.3% |
| Moroccans | 54.2 /100 | #170 | Average 23.3% |
| Cubans | 51.9 /100 | #171 | Average 23.3% |
| Germans | 50.5 /100 | #172 | Average 23.3% |
| Yugoslavians | 50.2 /100 | #173 | Average 23.3% |
| Immigrants | South Eastern Asia | 50.0 /100 | #174 | Average 23.3% |
| Dutch | 49.4 /100 | #175 | Average 23.3% |
Demographics Similar to Immigrants from Italy by Disability Age 65 to 74
In terms of disability age 65 to 74, the demographic groups most similar to Immigrants from Italy are Bhutanese (21.5%, a difference of 0.010%), Immigrants from France (21.5%, a difference of 0.020%), Immigrants from Romania (21.5%, a difference of 0.080%), Immigrants from Denmark (21.5%, a difference of 0.10%), and Immigrants from Asia (21.5%, a difference of 0.19%).
| Demographics | Rating | Rank | Disability Age 65 to 74 |
| Immigrants | Bulgaria | 99.7 /100 | #47 | Exceptional 21.4% |
| Lithuanians | 99.7 /100 | #48 | Exceptional 21.4% |
| Luxembourgers | 99.7 /100 | #49 | Exceptional 21.4% |
| Immigrants | Malaysia | 99.7 /100 | #50 | Exceptional 21.4% |
| Immigrants | Serbia | 99.6 /100 | #51 | Exceptional 21.4% |
| Immigrants | France | 99.6 /100 | #52 | Exceptional 21.5% |
| Bhutanese | 99.6 /100 | #53 | Exceptional 21.5% |
| Immigrants | Italy | 99.6 /100 | #54 | Exceptional 21.5% |
| Immigrants | Romania | 99.5 /100 | #55 | Exceptional 21.5% |
| Immigrants | Denmark | 99.5 /100 | #56 | Exceptional 21.5% |
| Immigrants | Asia | 99.5 /100 | #57 | Exceptional 21.5% |
| Immigrants | Pakistan | 99.5 /100 | #58 | Exceptional 21.5% |
| Zimbabweans | 99.5 /100 | #59 | Exceptional 21.5% |
| Immigrants | North Macedonia | 99.5 /100 | #60 | Exceptional 21.6% |
| Egyptians | 99.5 /100 | #61 | Exceptional 21.6% |