Puerto Rican vs Vietnamese Disability Age 65 to 74
COMPARE
Puerto Rican
Vietnamese
Disability Age 65 to 74
Disability Age 65 to 74 Comparison
Puerto Ricans
Vietnamese
29.1%
DISABILITY AGE 65 TO 74
0.0/ 100
METRIC RATING
323rd/ 347
METRIC RANK
23.2%
DISABILITY AGE 65 TO 74
60.8/ 100
METRIC RATING
165th/ 347
METRIC RANK
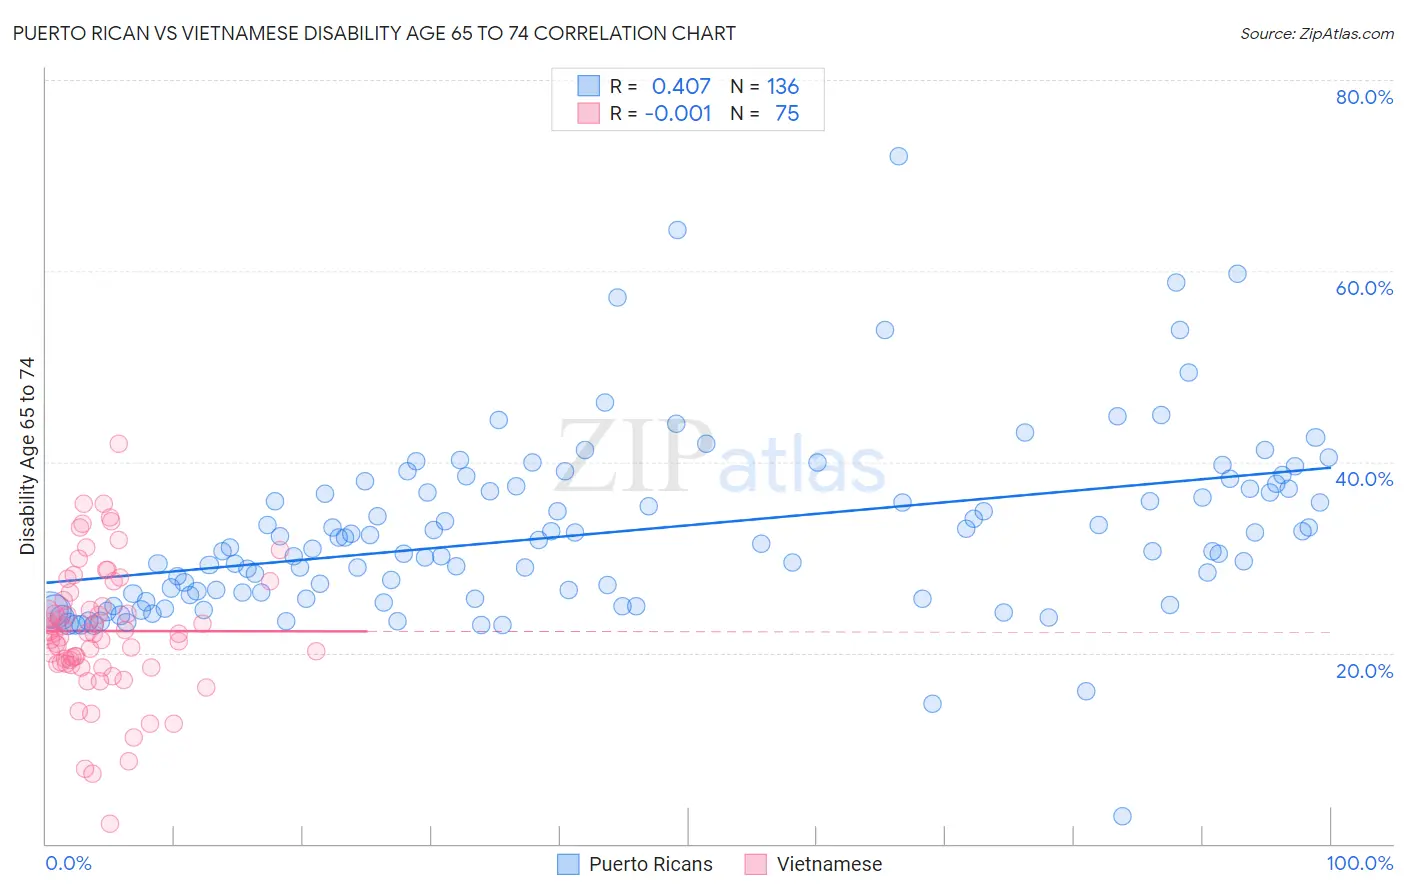
Puerto Rican vs Vietnamese Disability Age 65 to 74 Correlation Chart
The statistical analysis conducted on geographies consisting of 526,448,167 people shows a moderate positive correlation between the proportion of Puerto Ricans and percentage of population with a disability between the ages 65 and 75 in the United States with a correlation coefficient (R) of 0.407 and weighted average of 29.1%. Similarly, the statistical analysis conducted on geographies consisting of 170,489,851 people shows no correlation between the proportion of Vietnamese and percentage of population with a disability between the ages 65 and 75 in the United States with a correlation coefficient (R) of -0.001 and weighted average of 23.2%, a difference of 25.7%.
Disability Age 65 to 74 Correlation Summary
| Measurement | Puerto Rican | Vietnamese |
| Minimum | 2.9% | 2.1% |
| Maximum | 72.0% | 41.9% |
| Range | 69.1% | 39.8% |
| Mean | 32.6% | 22.3% |
| Median | 31.0% | 22.0% |
| Interquartile 25% (IQ1) | 25.9% | 18.8% |
| Interquartile 75% (IQ3) | 37.2% | 26.3% |
| Interquartile Range (IQR) | 11.3% | 7.5% |
| Standard Deviation (Sample) | 9.5% | 7.0% |
| Standard Deviation (Population) | 9.5% | 7.0% |
Similar Demographics by Disability Age 65 to 74
Demographics Similar to Puerto Ricans by Disability Age 65 to 74
In terms of disability age 65 to 74, the demographic groups most similar to Puerto Ricans are Seminole (29.4%, a difference of 0.97%), Dutch West Indian (29.6%, a difference of 1.4%), Yakama (29.6%, a difference of 1.7%), Apache (29.7%, a difference of 1.8%), and Aleut (28.4%, a difference of 2.5%).
| Demographics | Rating | Rank | Disability Age 65 to 74 |
| Crow | 0.0 /100 | #316 | Tragic 27.9% |
| Immigrants | Armenia | 0.0 /100 | #317 | Tragic 28.0% |
| Nepalese | 0.0 /100 | #318 | Tragic 28.0% |
| Arapaho | 0.0 /100 | #319 | Tragic 28.1% |
| Cherokee | 0.0 /100 | #320 | Tragic 28.2% |
| Comanche | 0.0 /100 | #321 | Tragic 28.3% |
| Aleuts | 0.0 /100 | #322 | Tragic 28.4% |
| Puerto Ricans | 0.0 /100 | #323 | Tragic 29.1% |
| Seminole | 0.0 /100 | #324 | Tragic 29.4% |
| Dutch West Indians | 0.0 /100 | #325 | Tragic 29.6% |
| Yakama | 0.0 /100 | #326 | Tragic 29.6% |
| Apache | 0.0 /100 | #327 | Tragic 29.7% |
| Hopi | 0.0 /100 | #328 | Tragic 30.0% |
| Choctaw | 0.0 /100 | #329 | Tragic 30.2% |
| Creek | 0.0 /100 | #330 | Tragic 30.2% |
Demographics Similar to Vietnamese by Disability Age 65 to 74
In terms of disability age 65 to 74, the demographic groups most similar to Vietnamese are Sierra Leonean (23.2%, a difference of 0.010%), Immigrants from Philippines (23.2%, a difference of 0.020%), Immigrants from Afghanistan (23.2%, a difference of 0.020%), European (23.2%, a difference of 0.030%), and Immigrants from Cameroon (23.1%, a difference of 0.19%).
| Demographics | Rating | Rank | Disability Age 65 to 74 |
| Immigrants | Vietnam | 69.1 /100 | #158 | Good 23.1% |
| South American Indians | 65.5 /100 | #159 | Good 23.1% |
| Koreans | 64.2 /100 | #160 | Good 23.1% |
| Immigrants | Cameroon | 63.8 /100 | #161 | Good 23.1% |
| Europeans | 61.2 /100 | #162 | Good 23.2% |
| Immigrants | Philippines | 61.1 /100 | #163 | Good 23.2% |
| Sierra Leoneans | 60.9 /100 | #164 | Good 23.2% |
| Vietnamese | 60.8 /100 | #165 | Good 23.2% |
| Immigrants | Afghanistan | 60.5 /100 | #166 | Good 23.2% |
| Immigrants | Bosnia and Herzegovina | 57.6 /100 | #167 | Average 23.2% |
| Pakistanis | 57.0 /100 | #168 | Average 23.2% |
| Icelanders | 54.3 /100 | #169 | Average 23.3% |
| Moroccans | 54.2 /100 | #170 | Average 23.3% |
| Cubans | 51.9 /100 | #171 | Average 23.3% |
| Germans | 50.5 /100 | #172 | Average 23.3% |