Russian vs Palestinian Disability Age 35 to 64
COMPARE
Russian
Palestinian
Disability Age 35 to 64
Disability Age 35 to 64 Comparison
Russians
Palestinians
10.2%
DISABILITY AGE 35 TO 64
99.2/ 100
METRIC RATING
82nd/ 347
METRIC RANK
10.4%
DISABILITY AGE 35 TO 64
98.2/ 100
METRIC RATING
99th/ 347
METRIC RANK
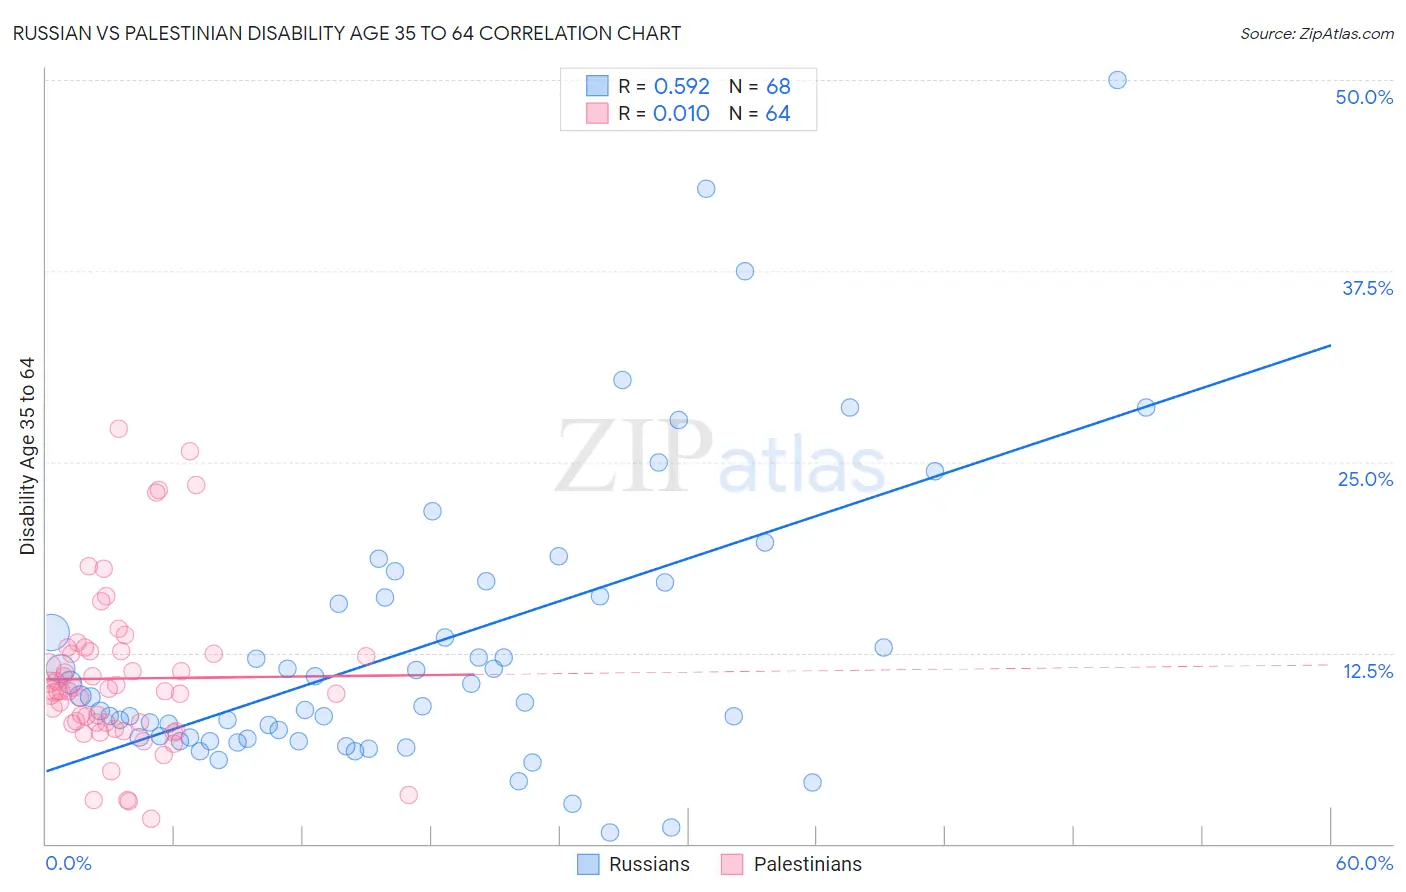
Russian vs Palestinian Disability Age 35 to 64 Correlation Chart
The statistical analysis conducted on geographies consisting of 511,532,980 people shows a substantial positive correlation between the proportion of Russians and percentage of population with a disability between the ages 34 and 64 in the United States with a correlation coefficient (R) of 0.592 and weighted average of 10.2%. Similarly, the statistical analysis conducted on geographies consisting of 216,388,113 people shows no correlation between the proportion of Palestinians and percentage of population with a disability between the ages 34 and 64 in the United States with a correlation coefficient (R) of 0.010 and weighted average of 10.4%, a difference of 1.8%.
Disability Age 35 to 64 Correlation Summary
| Measurement | Russian | Palestinian |
| Minimum | 0.73% | 1.6% |
| Maximum | 50.0% | 27.2% |
| Range | 49.3% | 25.5% |
| Mean | 12.8% | 10.8% |
| Median | 9.4% | 10.0% |
| Interquartile 25% (IQ1) | 6.9% | 7.9% |
| Interquartile 75% (IQ3) | 16.2% | 12.5% |
| Interquartile Range (IQR) | 9.3% | 4.6% |
| Standard Deviation (Sample) | 9.5% | 5.3% |
| Standard Deviation (Population) | 9.4% | 5.2% |
Demographics Similar to Russians and Palestinians by Disability Age 35 to 64
In terms of disability age 35 to 64, the demographic groups most similar to Russians are Immigrants from Brazil (10.2%, a difference of 0.020%), Latvian (10.2%, a difference of 0.060%), Sri Lankan (10.2%, a difference of 0.080%), Immigrants from Croatia (10.2%, a difference of 0.16%), and Immigrants from Kuwait (10.2%, a difference of 0.29%). Similarly, the demographic groups most similar to Palestinians are Immigrants from Uruguay (10.3%, a difference of 0.13%), Immigrants from Denmark (10.3%, a difference of 0.20%), Immigrants from Jordan (10.4%, a difference of 0.22%), Immigrants from South Africa (10.3%, a difference of 0.38%), and Immigrants from Italy (10.3%, a difference of 0.62%).
| Demographics | Rating | Rank | Disability Age 35 to 64 |
| Immigrants | Croatia | 99.3 /100 | #80 | Exceptional 10.2% |
| Latvians | 99.2 /100 | #81 | Exceptional 10.2% |
| Russians | 99.2 /100 | #82 | Exceptional 10.2% |
| Immigrants | Brazil | 99.2 /100 | #83 | Exceptional 10.2% |
| Sri Lankans | 99.2 /100 | #84 | Exceptional 10.2% |
| Immigrants | Kuwait | 99.1 /100 | #85 | Exceptional 10.2% |
| Immigrants | Europe | 99.1 /100 | #86 | Exceptional 10.2% |
| Nicaraguans | 99.1 /100 | #87 | Exceptional 10.2% |
| Chileans | 99.0 /100 | #88 | Exceptional 10.2% |
| Uruguayans | 99.0 /100 | #89 | Exceptional 10.2% |
| Afghans | 98.9 /100 | #90 | Exceptional 10.3% |
| Immigrants | Lebanon | 98.9 /100 | #91 | Exceptional 10.3% |
| Immigrants | Northern Africa | 98.7 /100 | #92 | Exceptional 10.3% |
| Immigrants | North Macedonia | 98.7 /100 | #93 | Exceptional 10.3% |
| Immigrants | Italy | 98.7 /100 | #94 | Exceptional 10.3% |
| Chinese | 98.7 /100 | #95 | Exceptional 10.3% |
| Immigrants | South Africa | 98.5 /100 | #96 | Exceptional 10.3% |
| Immigrants | Denmark | 98.4 /100 | #97 | Exceptional 10.3% |
| Immigrants | Uruguay | 98.3 /100 | #98 | Exceptional 10.3% |
| Palestinians | 98.2 /100 | #99 | Exceptional 10.4% |
| Immigrants | Jordan | 98.1 /100 | #100 | Exceptional 10.4% |