Salvadoran vs Slovak Ambulatory Disability
COMPARE
Salvadoran
Slovak
Ambulatory Disability
Ambulatory Disability Comparison
Salvadorans
Slovaks
5.8%
AMBULATORY DISABILITY
98.4/ 100
METRIC RATING
96th/ 347
METRIC RANK
6.7%
AMBULATORY DISABILITY
0.1/ 100
METRIC RATING
270th/ 347
METRIC RANK
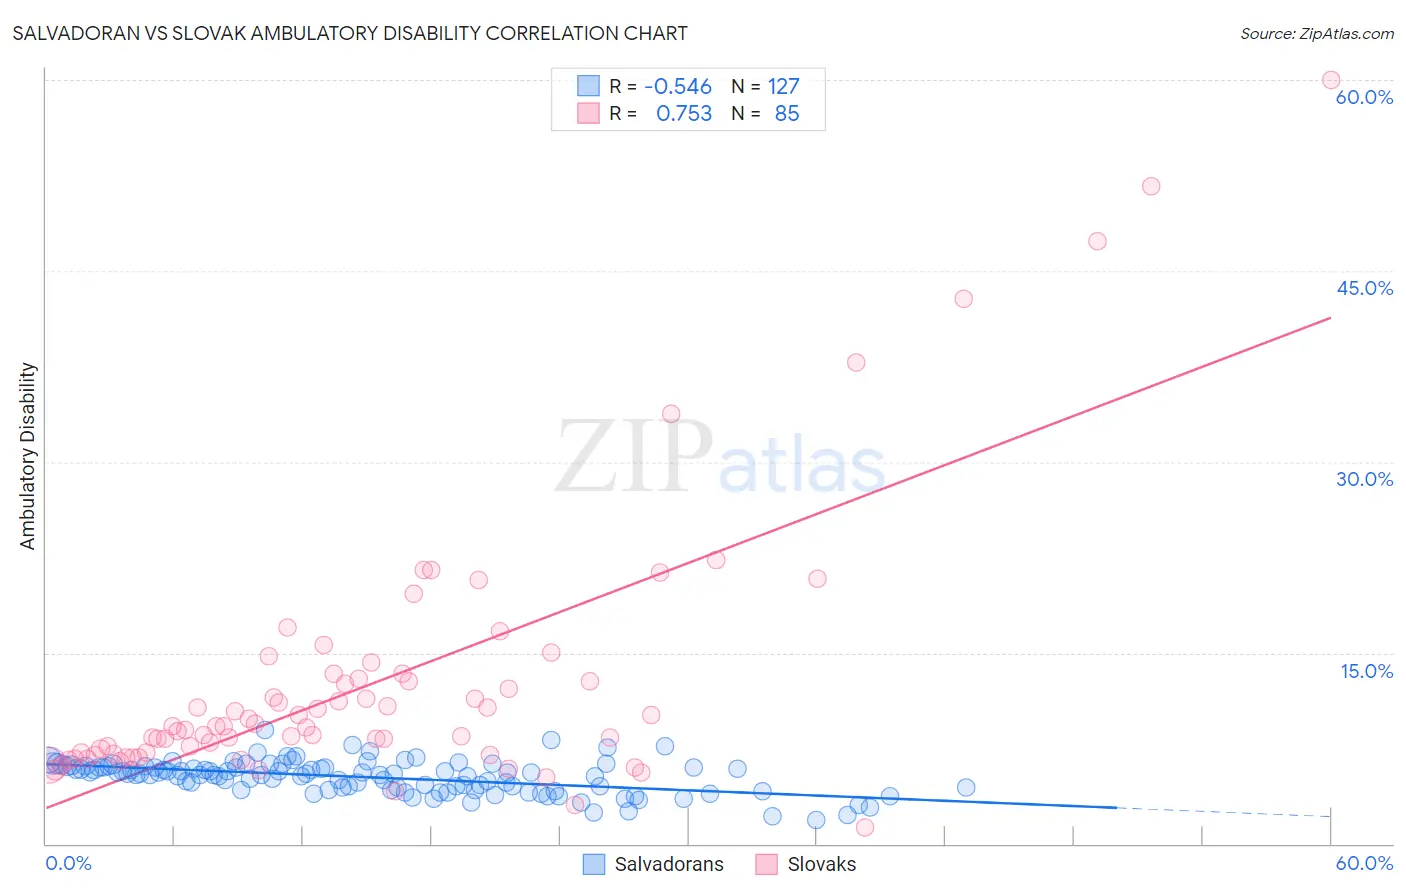
Salvadoran vs Slovak Ambulatory Disability Correlation Chart
The statistical analysis conducted on geographies consisting of 398,824,360 people shows a substantial negative correlation between the proportion of Salvadorans and percentage of population with ambulatory disability in the United States with a correlation coefficient (R) of -0.546 and weighted average of 5.8%. Similarly, the statistical analysis conducted on geographies consisting of 397,780,873 people shows a strong positive correlation between the proportion of Slovaks and percentage of population with ambulatory disability in the United States with a correlation coefficient (R) of 0.753 and weighted average of 6.7%, a difference of 15.1%.
Ambulatory Disability Correlation Summary
| Measurement | Salvadoran | Slovak |
| Minimum | 1.9% | 1.3% |
| Maximum | 8.9% | 60.0% |
| Range | 7.0% | 58.7% |
| Mean | 5.2% | 12.6% |
| Median | 5.5% | 9.2% |
| Interquartile 25% (IQ1) | 4.3% | 7.0% |
| Interquartile 75% (IQ3) | 6.0% | 13.2% |
| Interquartile Range (IQR) | 1.8% | 6.1% |
| Standard Deviation (Sample) | 1.3% | 10.4% |
| Standard Deviation (Population) | 1.3% | 10.3% |
Similar Demographics by Ambulatory Disability
Demographics Similar to Salvadorans by Ambulatory Disability
In terms of ambulatory disability, the demographic groups most similar to Salvadorans are Immigrants from El Salvador (5.8%, a difference of 0.020%), Immigrants from Somalia (5.8%, a difference of 0.040%), Kenyan (5.8%, a difference of 0.060%), Immigrants from Lebanon (5.8%, a difference of 0.070%), and Immigrants from Northern Europe (5.8%, a difference of 0.15%).
| Demographics | Rating | Rank | Ambulatory Disability |
| Bhutanese | 98.8 /100 | #89 | Exceptional 5.8% |
| Australians | 98.8 /100 | #90 | Exceptional 5.8% |
| Immigrants | Sudan | 98.8 /100 | #91 | Exceptional 5.8% |
| Immigrants | Sierra Leone | 98.6 /100 | #92 | Exceptional 5.8% |
| Immigrants | Denmark | 98.6 /100 | #93 | Exceptional 5.8% |
| Kenyans | 98.4 /100 | #94 | Exceptional 5.8% |
| Immigrants | El Salvador | 98.4 /100 | #95 | Exceptional 5.8% |
| Salvadorans | 98.4 /100 | #96 | Exceptional 5.8% |
| Immigrants | Somalia | 98.3 /100 | #97 | Exceptional 5.8% |
| Immigrants | Lebanon | 98.3 /100 | #98 | Exceptional 5.8% |
| Immigrants | Northern Europe | 98.2 /100 | #99 | Exceptional 5.8% |
| Immigrants | Serbia | 97.9 /100 | #100 | Exceptional 5.8% |
| Immigrants | South America | 97.9 /100 | #101 | Exceptional 5.8% |
| Immigrants | Kenya | 97.8 /100 | #102 | Exceptional 5.8% |
| Immigrants | Romania | 97.7 /100 | #103 | Exceptional 5.8% |
Demographics Similar to Slovaks by Ambulatory Disability
In terms of ambulatory disability, the demographic groups most similar to Slovaks are Immigrants from Trinidad and Tobago (6.7%, a difference of 0.10%), French (6.6%, a difference of 0.16%), French Canadian (6.7%, a difference of 0.46%), Spanish (6.6%, a difference of 0.47%), and Trinidadian and Tobagonian (6.6%, a difference of 0.48%).
| Demographics | Rating | Rank | Ambulatory Disability |
| Hmong | 0.3 /100 | #263 | Tragic 6.6% |
| Nepalese | 0.2 /100 | #264 | Tragic 6.6% |
| Bahamians | 0.2 /100 | #265 | Tragic 6.6% |
| Guyanese | 0.2 /100 | #266 | Tragic 6.6% |
| Trinidadians and Tobagonians | 0.2 /100 | #267 | Tragic 6.6% |
| Spanish | 0.2 /100 | #268 | Tragic 6.6% |
| French | 0.1 /100 | #269 | Tragic 6.6% |
| Slovaks | 0.1 /100 | #270 | Tragic 6.7% |
| Immigrants | Trinidad and Tobago | 0.1 /100 | #271 | Tragic 6.7% |
| French Canadians | 0.1 /100 | #272 | Tragic 6.7% |
| Whites/Caucasians | 0.1 /100 | #273 | Tragic 6.7% |
| Sioux | 0.1 /100 | #274 | Tragic 6.7% |
| Immigrants | Guyana | 0.1 /100 | #275 | Tragic 6.7% |
| Celtics | 0.1 /100 | #276 | Tragic 6.7% |
| Jamaicans | 0.1 /100 | #277 | Tragic 6.7% |