Seminole vs Guyanese Female Disability
COMPARE
Seminole
Guyanese
Female Disability
Female Disability Comparison
Seminole
Guyanese
15.0%
FEMALE DISABILITY
0.0/ 100
METRIC RATING
336th/ 347
METRIC RANK
12.1%
FEMALE DISABILITY
64.7/ 100
METRIC RATING
161st/ 347
METRIC RANK
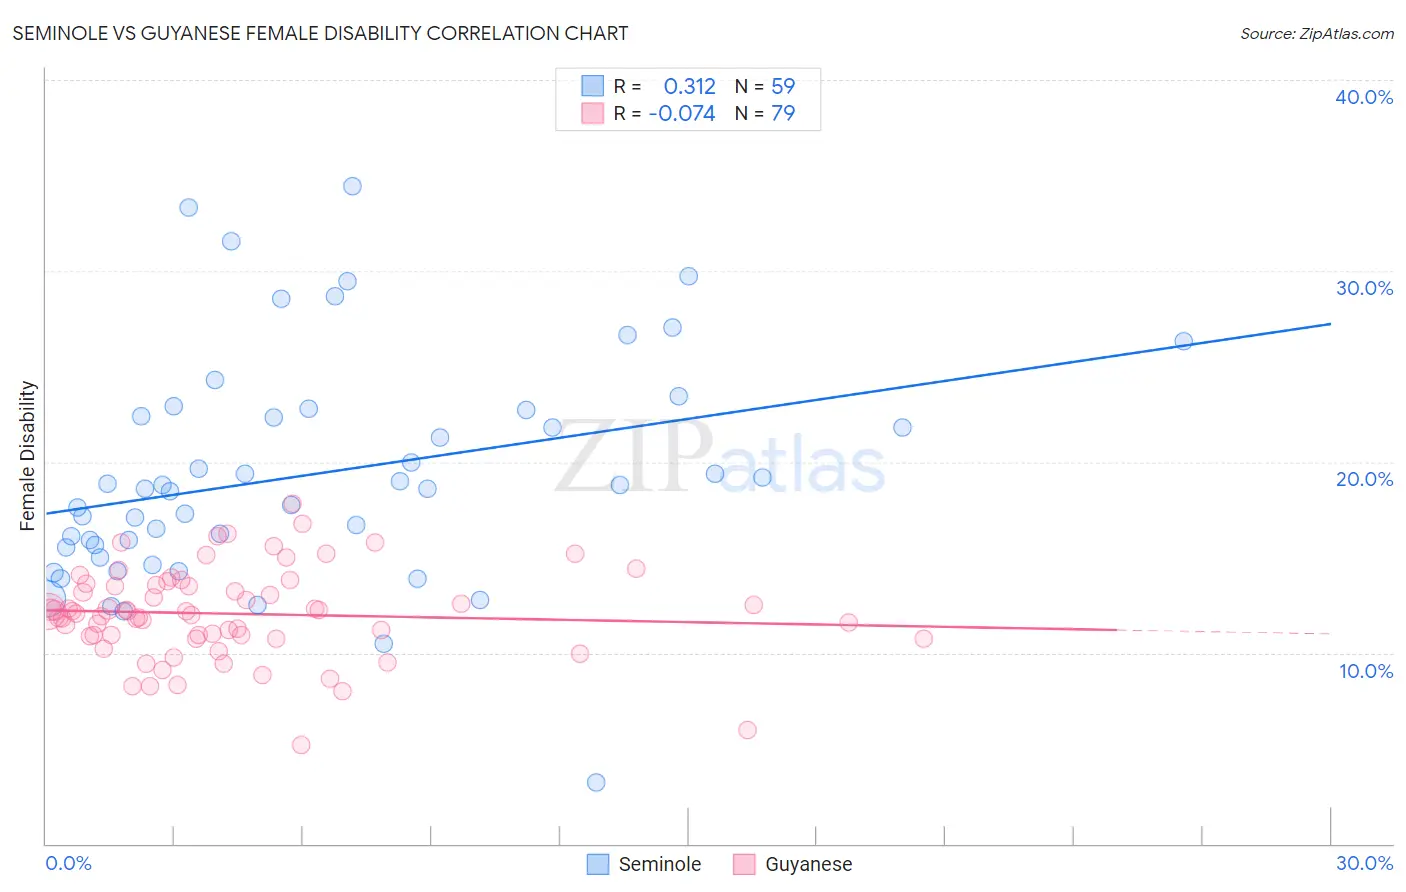
Seminole vs Guyanese Female Disability Correlation Chart
The statistical analysis conducted on geographies consisting of 118,309,192 people shows a mild positive correlation between the proportion of Seminole and percentage of females with a disability in the United States with a correlation coefficient (R) of 0.312 and weighted average of 15.0%. Similarly, the statistical analysis conducted on geographies consisting of 176,903,596 people shows a slight negative correlation between the proportion of Guyanese and percentage of females with a disability in the United States with a correlation coefficient (R) of -0.074 and weighted average of 12.1%, a difference of 23.4%.
Female Disability Correlation Summary
| Measurement | Seminole | Guyanese |
| Minimum | 3.2% | 5.2% |
| Maximum | 34.4% | 17.8% |
| Range | 31.3% | 12.6% |
| Mean | 19.4% | 12.0% |
| Median | 18.6% | 12.2% |
| Interquartile 25% (IQ1) | 15.5% | 10.8% |
| Interquartile 75% (IQ3) | 22.7% | 13.5% |
| Interquartile Range (IQR) | 7.2% | 2.7% |
| Standard Deviation (Sample) | 6.0% | 2.4% |
| Standard Deviation (Population) | 6.0% | 2.4% |
Similar Demographics by Female Disability
Demographics Similar to Seminole by Female Disability
In terms of female disability, the demographic groups most similar to Seminole are Tohono O'odham (15.0%, a difference of 0.12%), Dutch West Indian (15.0%, a difference of 0.26%), Cajun (14.9%, a difference of 0.67%), Colville (15.1%, a difference of 0.67%), and Cherokee (14.9%, a difference of 0.69%).
| Demographics | Rating | Rank | Female Disability |
| Osage | 0.0 /100 | #329 | Tragic 14.3% |
| Yuman | 0.0 /100 | #330 | Tragic 14.5% |
| Immigrants | Cabo Verde | 0.0 /100 | #331 | Tragic 14.6% |
| Pima | 0.0 /100 | #332 | Tragic 14.8% |
| Immigrants | Azores | 0.0 /100 | #333 | Tragic 14.9% |
| Cherokee | 0.0 /100 | #334 | Tragic 14.9% |
| Cajuns | 0.0 /100 | #335 | Tragic 14.9% |
| Seminole | 0.0 /100 | #336 | Tragic 15.0% |
| Tohono O'odham | 0.0 /100 | #337 | Tragic 15.0% |
| Dutch West Indians | 0.0 /100 | #338 | Tragic 15.0% |
| Colville | 0.0 /100 | #339 | Tragic 15.1% |
| Chickasaw | 0.0 /100 | #340 | Tragic 15.2% |
| Choctaw | 0.0 /100 | #341 | Tragic 15.4% |
| Creek | 0.0 /100 | #342 | Tragic 15.7% |
| Lumbee | 0.0 /100 | #343 | Tragic 15.8% |
Demographics Similar to Guyanese by Female Disability
In terms of female disability, the demographic groups most similar to Guyanese are Immigrants from Ukraine (12.1%, a difference of 0.010%), Guatemalan (12.1%, a difference of 0.030%), Czech (12.1%, a difference of 0.040%), Immigrants from Guatemala (12.1%, a difference of 0.060%), and Immigrants from Oceania (12.1%, a difference of 0.11%).
| Demographics | Rating | Rank | Female Disability |
| Syrians | 76.9 /100 | #154 | Good 12.1% |
| Ghanaians | 76.6 /100 | #155 | Good 12.1% |
| Moroccans | 72.9 /100 | #156 | Good 12.1% |
| Danes | 72.5 /100 | #157 | Good 12.1% |
| Immigrants | Middle Africa | 72.4 /100 | #158 | Good 12.1% |
| Immigrants | Central America | 67.7 /100 | #159 | Good 12.1% |
| Immigrants | Guatemala | 66.0 /100 | #160 | Good 12.1% |
| Guyanese | 64.7 /100 | #161 | Good 12.1% |
| Immigrants | Ukraine | 64.3 /100 | #162 | Good 12.1% |
| Guatemalans | 63.8 /100 | #163 | Good 12.1% |
| Czechs | 63.6 /100 | #164 | Good 12.1% |
| Immigrants | Oceania | 61.8 /100 | #165 | Good 12.1% |
| Lithuanians | 59.5 /100 | #166 | Average 12.2% |
| Immigrants | Latin America | 59.0 /100 | #167 | Average 12.2% |
| Immigrants | Haiti | 58.8 /100 | #168 | Average 12.2% |