Senegalese vs Costa Rican Disability Age 65 to 74
COMPARE
Senegalese
Costa Rican
Disability Age 65 to 74
Disability Age 65 to 74 Comparison
Senegalese
Costa Ricans
24.9%
DISABILITY AGE 65 TO 74
0.9/ 100
METRIC RATING
248th/ 347
METRIC RANK
22.6%
DISABILITY AGE 65 TO 74
89.2/ 100
METRIC RATING
132nd/ 347
METRIC RANK
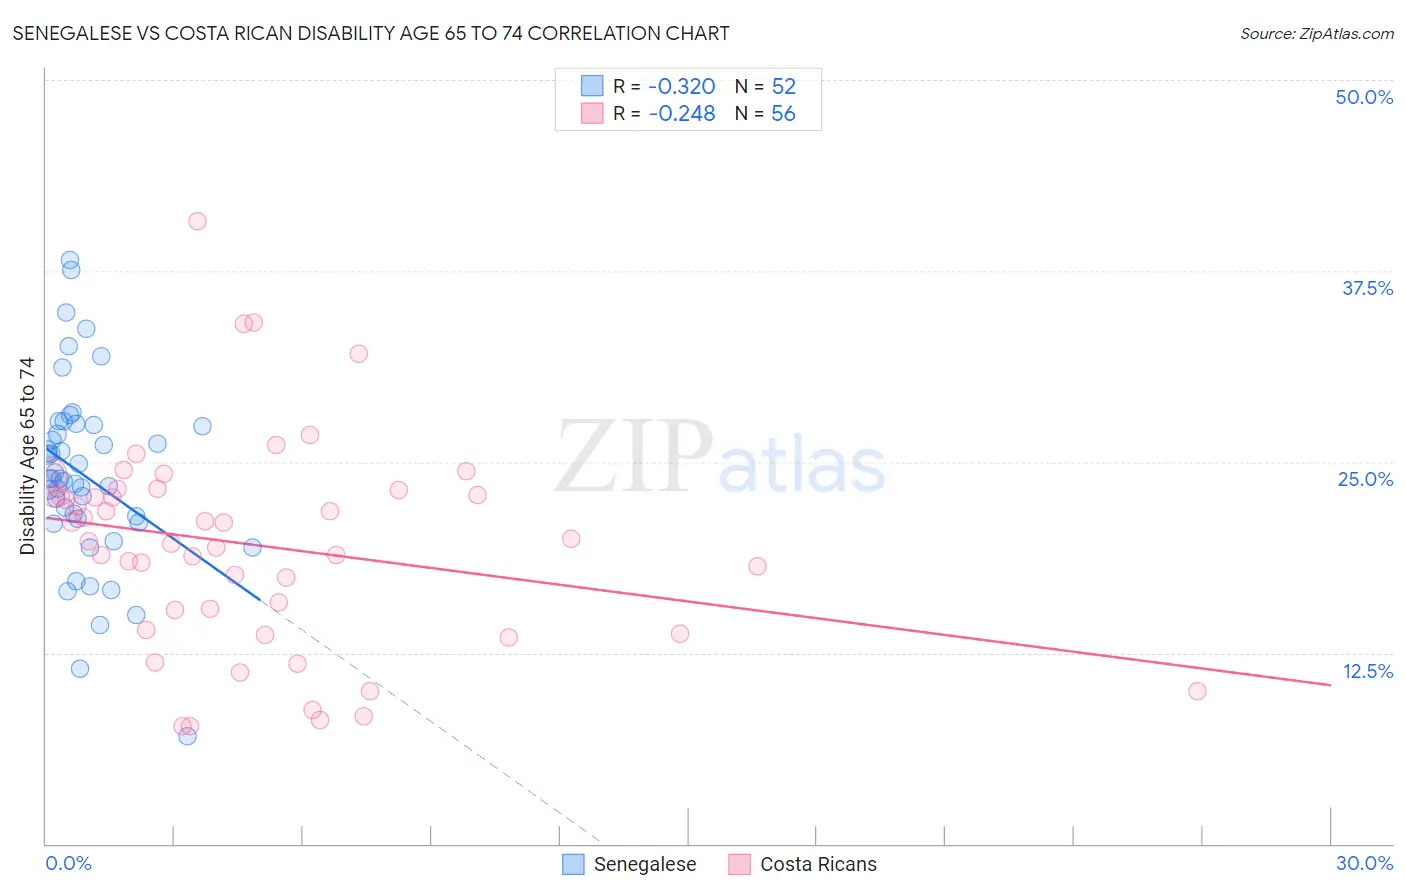
Senegalese vs Costa Rican Disability Age 65 to 74 Correlation Chart
The statistical analysis conducted on geographies consisting of 78,090,599 people shows a mild negative correlation between the proportion of Senegalese and percentage of population with a disability between the ages 65 and 75 in the United States with a correlation coefficient (R) of -0.320 and weighted average of 24.9%. Similarly, the statistical analysis conducted on geographies consisting of 253,274,171 people shows a weak negative correlation between the proportion of Costa Ricans and percentage of population with a disability between the ages 65 and 75 in the United States with a correlation coefficient (R) of -0.248 and weighted average of 22.6%, a difference of 10.2%.
Disability Age 65 to 74 Correlation Summary
| Measurement | Senegalese | Costa Rican |
| Minimum | 7.0% | 7.7% |
| Maximum | 38.2% | 40.7% |
| Range | 31.2% | 33.1% |
| Mean | 24.0% | 19.6% |
| Median | 23.9% | 19.9% |
| Interquartile 25% (IQ1) | 21.1% | 14.7% |
| Interquartile 75% (IQ3) | 27.4% | 23.0% |
| Interquartile Range (IQR) | 6.3% | 8.4% |
| Standard Deviation (Sample) | 6.0% | 6.9% |
| Standard Deviation (Population) | 6.0% | 6.8% |
Similar Demographics by Disability Age 65 to 74
Demographics Similar to Senegalese by Disability Age 65 to 74
In terms of disability age 65 to 74, the demographic groups most similar to Senegalese are Immigrants from Fiji (25.0%, a difference of 0.10%), Salvadoran (25.0%, a difference of 0.12%), Indonesian (24.9%, a difference of 0.25%), Nonimmigrants (25.0%, a difference of 0.32%), and Immigrants from El Salvador (25.1%, a difference of 0.51%).
| Demographics | Rating | Rank | Disability Age 65 to 74 |
| Immigrants | Western Africa | 2.3 /100 | #241 | Tragic 24.6% |
| Immigrants | Senegal | 2.2 /100 | #242 | Tragic 24.6% |
| Spanish | 2.2 /100 | #243 | Tragic 24.6% |
| Armenians | 2.0 /100 | #244 | Tragic 24.7% |
| British West Indians | 2.0 /100 | #245 | Tragic 24.7% |
| Immigrants | Iraq | 1.9 /100 | #246 | Tragic 24.7% |
| Indonesians | 1.1 /100 | #247 | Tragic 24.9% |
| Senegalese | 0.9 /100 | #248 | Tragic 24.9% |
| Immigrants | Fiji | 0.8 /100 | #249 | Tragic 25.0% |
| Salvadorans | 0.8 /100 | #250 | Tragic 25.0% |
| Immigrants | Nonimmigrants | 0.7 /100 | #251 | Tragic 25.0% |
| Immigrants | El Salvador | 0.6 /100 | #252 | Tragic 25.1% |
| Sub-Saharan Africans | 0.6 /100 | #253 | Tragic 25.1% |
| Somalis | 0.6 /100 | #254 | Tragic 25.1% |
| Central Americans | 0.5 /100 | #255 | Tragic 25.1% |
Demographics Similar to Costa Ricans by Disability Age 65 to 74
In terms of disability age 65 to 74, the demographic groups most similar to Costa Ricans are Immigrants from Nepal (22.6%, a difference of 0.040%), Northern European (22.6%, a difference of 0.050%), Afghan (22.6%, a difference of 0.10%), Immigrants from Albania (22.6%, a difference of 0.13%), and Immigrants from Ukraine (22.6%, a difference of 0.13%).
| Demographics | Rating | Rank | Disability Age 65 to 74 |
| Immigrants | Western Europe | 92.3 /100 | #125 | Exceptional 22.5% |
| Lebanese | 92.2 /100 | #126 | Exceptional 22.5% |
| Slovaks | 91.6 /100 | #127 | Exceptional 22.5% |
| Immigrants | Costa Rica | 90.4 /100 | #128 | Exceptional 22.6% |
| Immigrants | Uruguay | 90.1 /100 | #129 | Exceptional 22.6% |
| Immigrants | Albania | 90.0 /100 | #130 | Excellent 22.6% |
| Immigrants | Nepal | 89.4 /100 | #131 | Excellent 22.6% |
| Costa Ricans | 89.2 /100 | #132 | Excellent 22.6% |
| Northern Europeans | 88.9 /100 | #133 | Excellent 22.6% |
| Afghans | 88.6 /100 | #134 | Excellent 22.6% |
| Immigrants | Ukraine | 88.4 /100 | #135 | Excellent 22.6% |
| Ethiopians | 87.9 /100 | #136 | Excellent 22.7% |
| Taiwanese | 87.6 /100 | #137 | Excellent 22.7% |
| Immigrants | Moldova | 87.3 /100 | #138 | Excellent 22.7% |
| Immigrants | Syria | 85.8 /100 | #139 | Excellent 22.7% |