Serbian vs Immigrants from Bolivia Male Disability
COMPARE
Serbian
Immigrants from Bolivia
Male Disability
Male Disability Comparison
Serbians
Immigrants from Bolivia
11.5%
MALE DISABILITY
10.7/ 100
METRIC RATING
205th/ 347
METRIC RANK
9.5%
MALE DISABILITY
100.0/ 100
METRIC RATING
7th/ 347
METRIC RANK
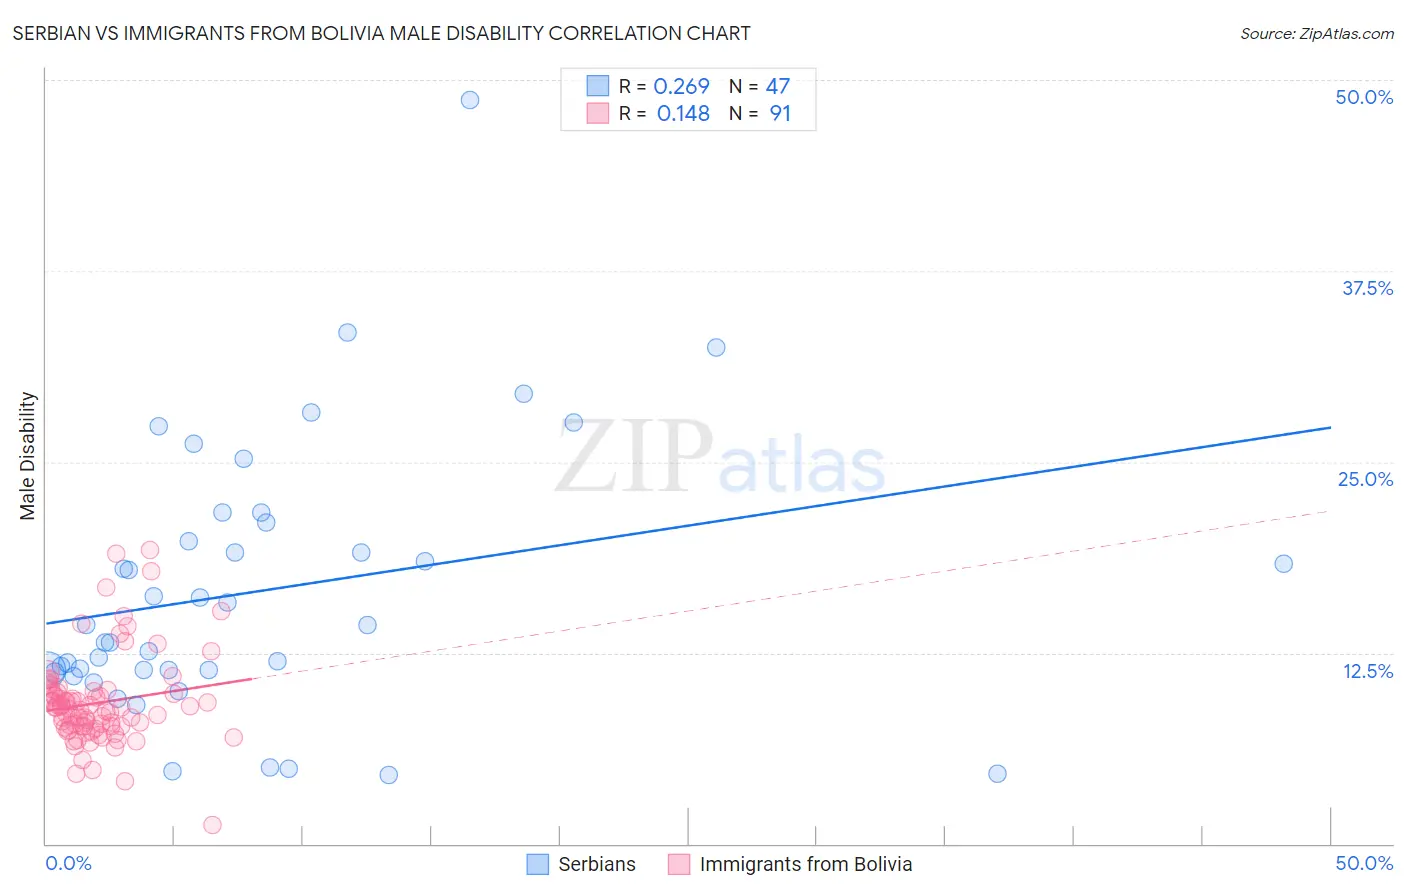
Serbian vs Immigrants from Bolivia Male Disability Correlation Chart
The statistical analysis conducted on geographies consisting of 267,640,230 people shows a weak positive correlation between the proportion of Serbians and percentage of males with a disability in the United States with a correlation coefficient (R) of 0.269 and weighted average of 11.5%. Similarly, the statistical analysis conducted on geographies consisting of 158,713,247 people shows a poor positive correlation between the proportion of Immigrants from Bolivia and percentage of males with a disability in the United States with a correlation coefficient (R) of 0.148 and weighted average of 9.5%, a difference of 22.0%.
Male Disability Correlation Summary
| Measurement | Serbian | Immigrants from Bolivia |
| Minimum | 4.5% | 1.2% |
| Maximum | 48.7% | 19.2% |
| Range | 44.3% | 18.0% |
| Mean | 16.6% | 9.2% |
| Median | 14.3% | 8.8% |
| Interquartile 25% (IQ1) | 11.3% | 7.7% |
| Interquartile 75% (IQ3) | 21.0% | 9.9% |
| Interquartile Range (IQR) | 9.7% | 2.2% |
| Standard Deviation (Sample) | 8.8% | 3.0% |
| Standard Deviation (Population) | 8.8% | 3.0% |
Similar Demographics by Male Disability
Demographics Similar to Serbians by Male Disability
In terms of male disability, the demographic groups most similar to Serbians are Immigrants from Cambodia (11.5%, a difference of 0.0%), Ukrainian (11.5%, a difference of 0.010%), Jamaican (11.5%, a difference of 0.020%), Immigrants from Somalia (11.5%, a difference of 0.040%), and Icelander (11.6%, a difference of 0.080%).
| Demographics | Rating | Rank | Male Disability |
| Immigrants | Jamaica | 16.3 /100 | #198 | Poor 11.5% |
| Lebanese | 15.4 /100 | #199 | Poor 11.5% |
| Immigrants | Iraq | 13.0 /100 | #200 | Poor 11.5% |
| Immigrants | Panama | 13.0 /100 | #201 | Poor 11.5% |
| Immigrants | Mexico | 12.6 /100 | #202 | Poor 11.5% |
| Jamaicans | 10.9 /100 | #203 | Poor 11.5% |
| Immigrants | Cambodia | 10.8 /100 | #204 | Poor 11.5% |
| Serbians | 10.7 /100 | #205 | Poor 11.5% |
| Ukrainians | 10.6 /100 | #206 | Poor 11.5% |
| Immigrants | Somalia | 10.4 /100 | #207 | Poor 11.5% |
| Icelanders | 10.1 /100 | #208 | Poor 11.6% |
| Spanish American Indians | 10.1 /100 | #209 | Poor 11.6% |
| Ute | 9.4 /100 | #210 | Tragic 11.6% |
| Immigrants | Thailand | 8.4 /100 | #211 | Tragic 11.6% |
| Immigrants | Scotland | 8.2 /100 | #212 | Tragic 11.6% |
Demographics Similar to Immigrants from Bolivia by Male Disability
In terms of male disability, the demographic groups most similar to Immigrants from Bolivia are Immigrants from South Central Asia (9.4%, a difference of 0.33%), Immigrants from Hong Kong (9.4%, a difference of 0.39%), Immigrants from China (9.5%, a difference of 0.60%), Immigrants from Singapore (9.5%, a difference of 0.68%), and Immigrants from Israel (9.6%, a difference of 1.1%).
| Demographics | Rating | Rank | Male Disability |
| Immigrants | India | 100.0 /100 | #1 | Exceptional 9.0% |
| Immigrants | Taiwan | 100.0 /100 | #2 | Exceptional 9.1% |
| Filipinos | 100.0 /100 | #3 | Exceptional 9.1% |
| Thais | 100.0 /100 | #4 | Exceptional 9.2% |
| Immigrants | Hong Kong | 100.0 /100 | #5 | Exceptional 9.4% |
| Immigrants | South Central Asia | 100.0 /100 | #6 | Exceptional 9.4% |
| Immigrants | Bolivia | 100.0 /100 | #7 | Exceptional 9.5% |
| Immigrants | China | 100.0 /100 | #8 | Exceptional 9.5% |
| Immigrants | Singapore | 100.0 /100 | #9 | Exceptional 9.5% |
| Immigrants | Israel | 100.0 /100 | #10 | Exceptional 9.6% |
| Immigrants | Eastern Asia | 100.0 /100 | #11 | Exceptional 9.6% |
| Bolivians | 100.0 /100 | #12 | Exceptional 9.6% |
| Iranians | 100.0 /100 | #13 | Exceptional 9.7% |
| Immigrants | Iran | 100.0 /100 | #14 | Exceptional 9.7% |
| Indians (Asian) | 100.0 /100 | #15 | Exceptional 9.7% |