South American vs European Male Disability
COMPARE
South American
European
Male Disability
Male Disability Comparison
South Americans
Europeans
10.3%
MALE DISABILITY
99.6/ 100
METRIC RATING
50th/ 347
METRIC RANK
12.1%
MALE DISABILITY
0.3/ 100
METRIC RATING
257th/ 347
METRIC RANK
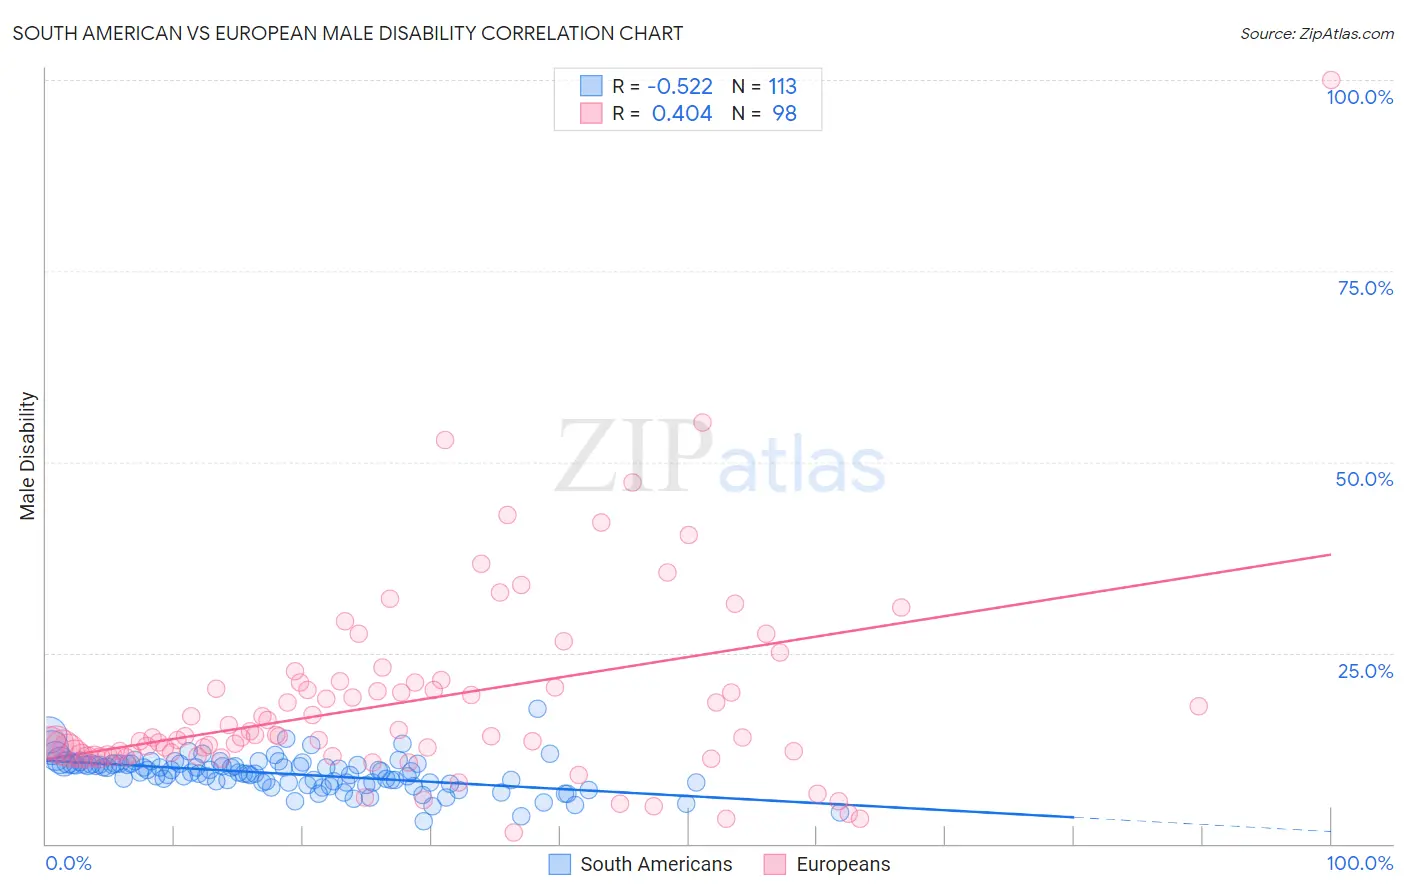
South American vs European Male Disability Correlation Chart
The statistical analysis conducted on geographies consisting of 494,014,991 people shows a substantial negative correlation between the proportion of South Americans and percentage of males with a disability in the United States with a correlation coefficient (R) of -0.522 and weighted average of 10.3%. Similarly, the statistical analysis conducted on geographies consisting of 561,596,268 people shows a moderate positive correlation between the proportion of Europeans and percentage of males with a disability in the United States with a correlation coefficient (R) of 0.404 and weighted average of 12.1%, a difference of 17.0%.
Male Disability Correlation Summary
| Measurement | South American | European |
| Minimum | 2.9% | 1.4% |
| Maximum | 17.7% | 100.0% |
| Range | 14.8% | 98.6% |
| Mean | 9.2% | 18.6% |
| Median | 9.4% | 14.0% |
| Interquartile 25% (IQ1) | 8.0% | 11.6% |
| Interquartile 75% (IQ3) | 10.4% | 21.1% |
| Interquartile Range (IQR) | 2.5% | 9.4% |
| Standard Deviation (Sample) | 2.2% | 13.4% |
| Standard Deviation (Population) | 2.2% | 13.3% |
Similar Demographics by Male Disability
Demographics Similar to South Americans by Male Disability
In terms of male disability, the demographic groups most similar to South Americans are Immigrants from Spain (10.3%, a difference of 0.13%), Israeli (10.3%, a difference of 0.19%), Salvadoran (10.4%, a difference of 0.19%), Immigrants from Saudi Arabia (10.4%, a difference of 0.21%), and Immigrants from Peru (10.3%, a difference of 0.23%).
| Demographics | Rating | Rank | Male Disability |
| Immigrants | Bangladesh | 99.7 /100 | #43 | Exceptional 10.3% |
| Immigrants | El Salvador | 99.7 /100 | #44 | Exceptional 10.3% |
| Turks | 99.7 /100 | #45 | Exceptional 10.3% |
| Cambodians | 99.7 /100 | #46 | Exceptional 10.3% |
| Immigrants | Peru | 99.7 /100 | #47 | Exceptional 10.3% |
| Israelis | 99.7 /100 | #48 | Exceptional 10.3% |
| Immigrants | Spain | 99.7 /100 | #49 | Exceptional 10.3% |
| South Americans | 99.6 /100 | #50 | Exceptional 10.3% |
| Salvadorans | 99.6 /100 | #51 | Exceptional 10.4% |
| Immigrants | Saudi Arabia | 99.6 /100 | #52 | Exceptional 10.4% |
| Immigrants | Uzbekistan | 99.6 /100 | #53 | Exceptional 10.4% |
| Peruvians | 99.6 /100 | #54 | Exceptional 10.4% |
| Immigrants | Eritrea | 99.6 /100 | #55 | Exceptional 10.4% |
| Tongans | 99.6 /100 | #56 | Exceptional 10.4% |
| Immigrants | South America | 99.6 /100 | #57 | Exceptional 10.4% |
Demographics Similar to Europeans by Male Disability
In terms of male disability, the demographic groups most similar to Europeans are Swiss (12.1%, a difference of 0.0%), Basque (12.1%, a difference of 0.19%), Belgian (12.1%, a difference of 0.24%), Chinese (12.1%, a difference of 0.25%), and British (12.1%, a difference of 0.26%).
| Demographics | Rating | Rank | Male Disability |
| Bangladeshis | 0.5 /100 | #250 | Tragic 12.0% |
| German Russians | 0.5 /100 | #251 | Tragic 12.0% |
| Slovenes | 0.5 /100 | #252 | Tragic 12.0% |
| Guamanians/Chamorros | 0.5 /100 | #253 | Tragic 12.0% |
| British | 0.4 /100 | #254 | Tragic 12.1% |
| Chinese | 0.4 /100 | #255 | Tragic 12.1% |
| Swiss | 0.3 /100 | #256 | Tragic 12.1% |
| Europeans | 0.3 /100 | #257 | Tragic 12.1% |
| Basques | 0.3 /100 | #258 | Tragic 12.1% |
| Belgians | 0.3 /100 | #259 | Tragic 12.1% |
| Swedes | 0.3 /100 | #260 | Tragic 12.1% |
| Slavs | 0.2 /100 | #261 | Tragic 12.2% |
| Norwegians | 0.2 /100 | #262 | Tragic 12.2% |
| Canadians | 0.2 /100 | #263 | Tragic 12.2% |
| Nepalese | 0.2 /100 | #264 | Tragic 12.2% |