Subsaharan African vs Polish Ambulatory Disability
COMPARE
Subsaharan African
Polish
Ambulatory Disability
Ambulatory Disability Comparison
Sub-Saharan Africans
Poles
6.4%
AMBULATORY DISABILITY
2.3/ 100
METRIC RATING
233rd/ 347
METRIC RANK
6.2%
AMBULATORY DISABILITY
26.3/ 100
METRIC RATING
197th/ 347
METRIC RANK
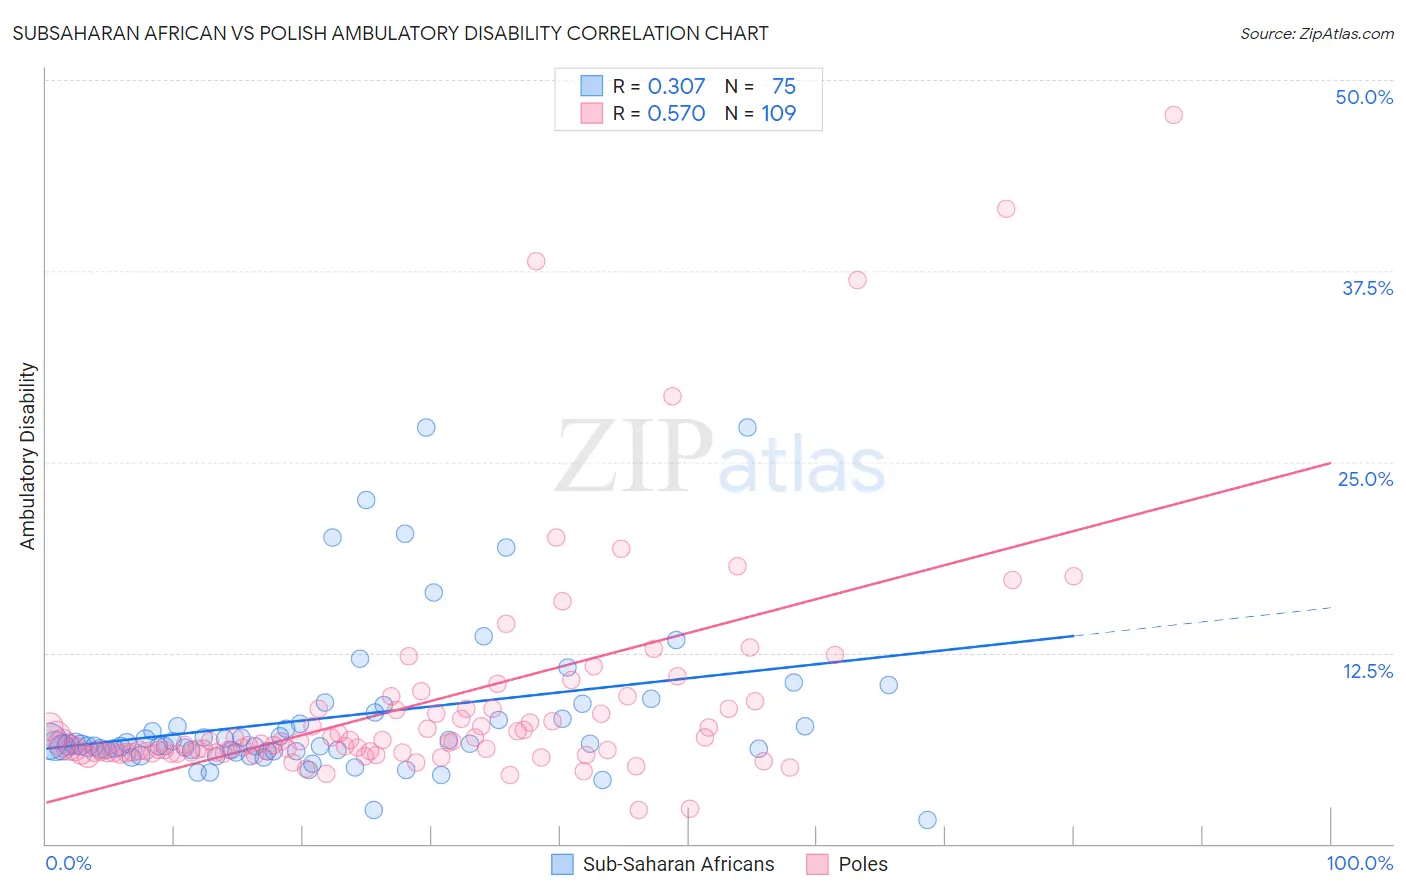
Subsaharan African vs Polish Ambulatory Disability Correlation Chart
The statistical analysis conducted on geographies consisting of 507,846,771 people shows a mild positive correlation between the proportion of Sub-Saharan Africans and percentage of population with ambulatory disability in the United States with a correlation coefficient (R) of 0.307 and weighted average of 6.4%. Similarly, the statistical analysis conducted on geographies consisting of 560,051,234 people shows a substantial positive correlation between the proportion of Poles and percentage of population with ambulatory disability in the United States with a correlation coefficient (R) of 0.570 and weighted average of 6.2%, a difference of 3.5%.
Ambulatory Disability Correlation Summary
| Measurement | Subsaharan African | Polish |
| Minimum | 1.5% | 2.2% |
| Maximum | 27.3% | 47.7% |
| Range | 25.7% | 45.5% |
| Mean | 8.3% | 9.1% |
| Median | 6.5% | 6.6% |
| Interquartile 25% (IQ1) | 6.1% | 6.0% |
| Interquartile 75% (IQ3) | 8.2% | 8.8% |
| Interquartile Range (IQR) | 2.1% | 2.8% |
| Standard Deviation (Sample) | 5.0% | 7.4% |
| Standard Deviation (Population) | 4.9% | 7.3% |
Similar Demographics by Ambulatory Disability
Demographics Similar to Sub-Saharan Africans by Ambulatory Disability
In terms of ambulatory disability, the demographic groups most similar to Sub-Saharan Africans are Immigrants from Liberia (6.4%, a difference of 0.030%), Assyrian/Chaldean/Syriac (6.4%, a difference of 0.060%), Hispanic or Latino (6.4%, a difference of 0.060%), Dutch (6.4%, a difference of 0.21%), and Immigrants from Germany (6.4%, a difference of 0.30%).
| Demographics | Rating | Rank | Ambulatory Disability |
| Slavs | 5.1 /100 | #226 | Tragic 6.4% |
| Cubans | 4.0 /100 | #227 | Tragic 6.4% |
| Portuguese | 4.0 /100 | #228 | Tragic 6.4% |
| Czechoslovakians | 3.8 /100 | #229 | Tragic 6.4% |
| Mexicans | 3.5 /100 | #230 | Tragic 6.4% |
| Panamanians | 3.1 /100 | #231 | Tragic 6.4% |
| Assyrians/Chaldeans/Syriacs | 2.4 /100 | #232 | Tragic 6.4% |
| Sub-Saharan Africans | 2.3 /100 | #233 | Tragic 6.4% |
| Immigrants | Liberia | 2.3 /100 | #234 | Tragic 6.4% |
| Hispanics or Latinos | 2.2 /100 | #235 | Tragic 6.4% |
| Dutch | 2.0 /100 | #236 | Tragic 6.4% |
| Immigrants | Germany | 1.8 /100 | #237 | Tragic 6.4% |
| Haitians | 1.8 /100 | #238 | Tragic 6.4% |
| Senegalese | 1.7 /100 | #239 | Tragic 6.4% |
| Immigrants | Senegal | 1.7 /100 | #240 | Tragic 6.4% |
Demographics Similar to Poles by Ambulatory Disability
In terms of ambulatory disability, the demographic groups most similar to Poles are Malaysian (6.2%, a difference of 0.12%), Immigrants from Bangladesh (6.2%, a difference of 0.12%), Belgian (6.2%, a difference of 0.15%), Alaska Native (6.2%, a difference of 0.23%), and Guatemalan (6.2%, a difference of 0.24%).
| Demographics | Rating | Rank | Ambulatory Disability |
| Immigrants | Western Africa | 33.4 /100 | #190 | Fair 6.2% |
| Immigrants | Guatemala | 31.9 /100 | #191 | Fair 6.2% |
| Immigrants | Western Europe | 31.6 /100 | #192 | Fair 6.2% |
| Guatemalans | 30.0 /100 | #193 | Fair 6.2% |
| Alaska Natives | 29.8 /100 | #194 | Fair 6.2% |
| Belgians | 28.6 /100 | #195 | Fair 6.2% |
| Malaysians | 28.2 /100 | #196 | Fair 6.2% |
| Poles | 26.3 /100 | #197 | Fair 6.2% |
| Immigrants | Bangladesh | 24.6 /100 | #198 | Fair 6.2% |
| Italians | 22.6 /100 | #199 | Fair 6.2% |
| Immigrants | Cambodia | 21.5 /100 | #200 | Fair 6.2% |
| Immigrants | Central America | 20.1 /100 | #201 | Fair 6.2% |
| Albanians | 19.7 /100 | #202 | Poor 6.2% |
| Immigrants | Ukraine | 18.4 /100 | #203 | Poor 6.2% |
| Immigrants | Congo | 18.2 /100 | #204 | Poor 6.2% |