Swedish vs Basque Hearing Disability
COMPARE
Swedish
Basque
Hearing Disability
Hearing Disability Comparison
Swedes
Basques
3.6%
HEARING DISABILITY
0.0/ 100
METRIC RATING
282nd/ 347
METRIC RANK
3.6%
HEARING DISABILITY
0.0/ 100
METRIC RATING
278th/ 347
METRIC RANK
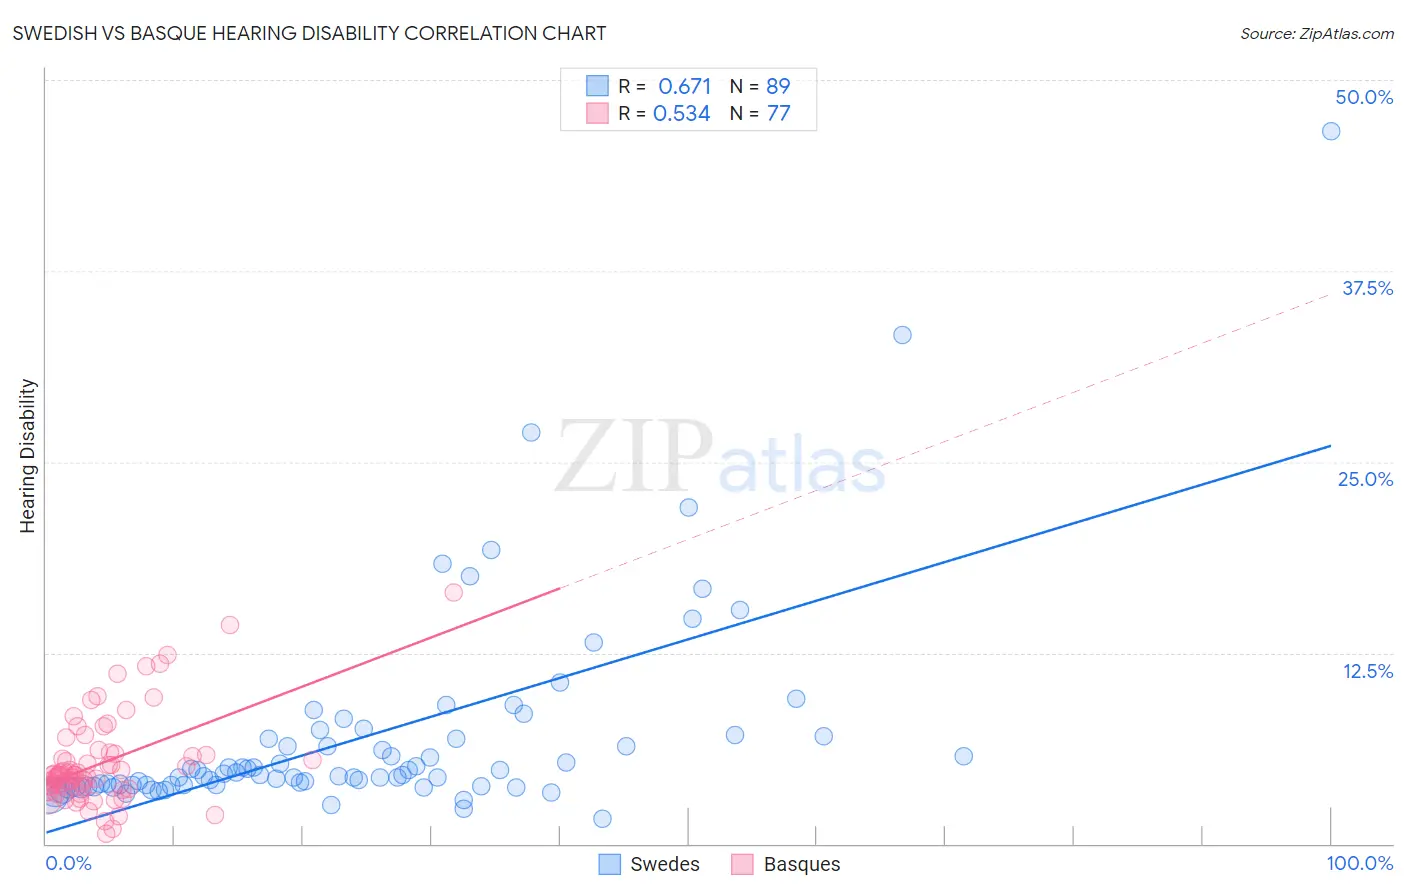
Swedish vs Basque Hearing Disability Correlation Chart
The statistical analysis conducted on geographies consisting of 538,765,459 people shows a significant positive correlation between the proportion of Swedes and percentage of population with hearing disability in the United States with a correlation coefficient (R) of 0.671 and weighted average of 3.6%. Similarly, the statistical analysis conducted on geographies consisting of 165,769,952 people shows a substantial positive correlation between the proportion of Basques and percentage of population with hearing disability in the United States with a correlation coefficient (R) of 0.534 and weighted average of 3.6%, a difference of 0.48%.
Hearing Disability Correlation Summary
| Measurement | Swedish | Basque |
| Minimum | 1.7% | 0.68% |
| Maximum | 46.7% | 16.4% |
| Range | 45.0% | 15.7% |
| Mean | 7.0% | 5.3% |
| Median | 4.5% | 4.5% |
| Interquartile 25% (IQ1) | 3.8% | 3.6% |
| Interquartile 75% (IQ3) | 6.9% | 5.9% |
| Interquartile Range (IQR) | 3.1% | 2.2% |
| Standard Deviation (Sample) | 6.8% | 2.9% |
| Standard Deviation (Population) | 6.8% | 2.9% |
Demographics Similar to Swedes and Basques by Hearing Disability
In terms of hearing disability, the demographic groups most similar to Swedes are Scandinavian (3.6%, a difference of 0.090%), French American Indian (3.6%, a difference of 0.15%), Slovak (3.6%, a difference of 0.21%), Blackfeet (3.6%, a difference of 0.25%), and Immigrants from Micronesia (3.6%, a difference of 0.72%). Similarly, the demographic groups most similar to Basques are Slovak (3.6%, a difference of 0.26%), French American Indian (3.6%, a difference of 0.33%), Nonimmigrants (3.6%, a difference of 0.39%), Scandinavian (3.6%, a difference of 0.39%), and Blackfeet (3.6%, a difference of 0.73%).
| Demographics | Rating | Rank | Hearing Disability |
| Europeans | 0.1 /100 | #270 | Tragic 3.5% |
| Czechs | 0.1 /100 | #271 | Tragic 3.5% |
| Fijians | 0.0 /100 | #272 | Tragic 3.5% |
| Puerto Ricans | 0.0 /100 | #273 | Tragic 3.5% |
| Swiss | 0.0 /100 | #274 | Tragic 3.5% |
| Czechoslovakians | 0.0 /100 | #275 | Tragic 3.6% |
| Danes | 0.0 /100 | #276 | Tragic 3.6% |
| Immigrants | Nonimmigrants | 0.0 /100 | #277 | Tragic 3.6% |
| Basques | 0.0 /100 | #278 | Tragic 3.6% |
| Slovaks | 0.0 /100 | #279 | Tragic 3.6% |
| French American Indians | 0.0 /100 | #280 | Tragic 3.6% |
| Scandinavians | 0.0 /100 | #281 | Tragic 3.6% |
| Swedes | 0.0 /100 | #282 | Tragic 3.6% |
| Blackfeet | 0.0 /100 | #283 | Tragic 3.6% |
| Immigrants | Micronesia | 0.0 /100 | #284 | Tragic 3.6% |
| Sioux | 0.0 /100 | #285 | Tragic 3.6% |
| Delaware | 0.0 /100 | #286 | Tragic 3.6% |
| Spanish | 0.0 /100 | #287 | Tragic 3.7% |
| Irish | 0.0 /100 | #288 | Tragic 3.7% |
| Chinese | 0.0 /100 | #289 | Tragic 3.7% |
| Whites/Caucasians | 0.0 /100 | #290 | Tragic 3.7% |