Ukrainian vs Immigrants from Ukraine Female Disability
COMPARE
Ukrainian
Immigrants from Ukraine
Female Disability
Female Disability Comparison
Ukrainians
Immigrants from Ukraine
12.3%
FEMALE DISABILITY
27.2/ 100
METRIC RATING
194th/ 347
METRIC RANK
12.1%
FEMALE DISABILITY
64.3/ 100
METRIC RATING
162nd/ 347
METRIC RANK
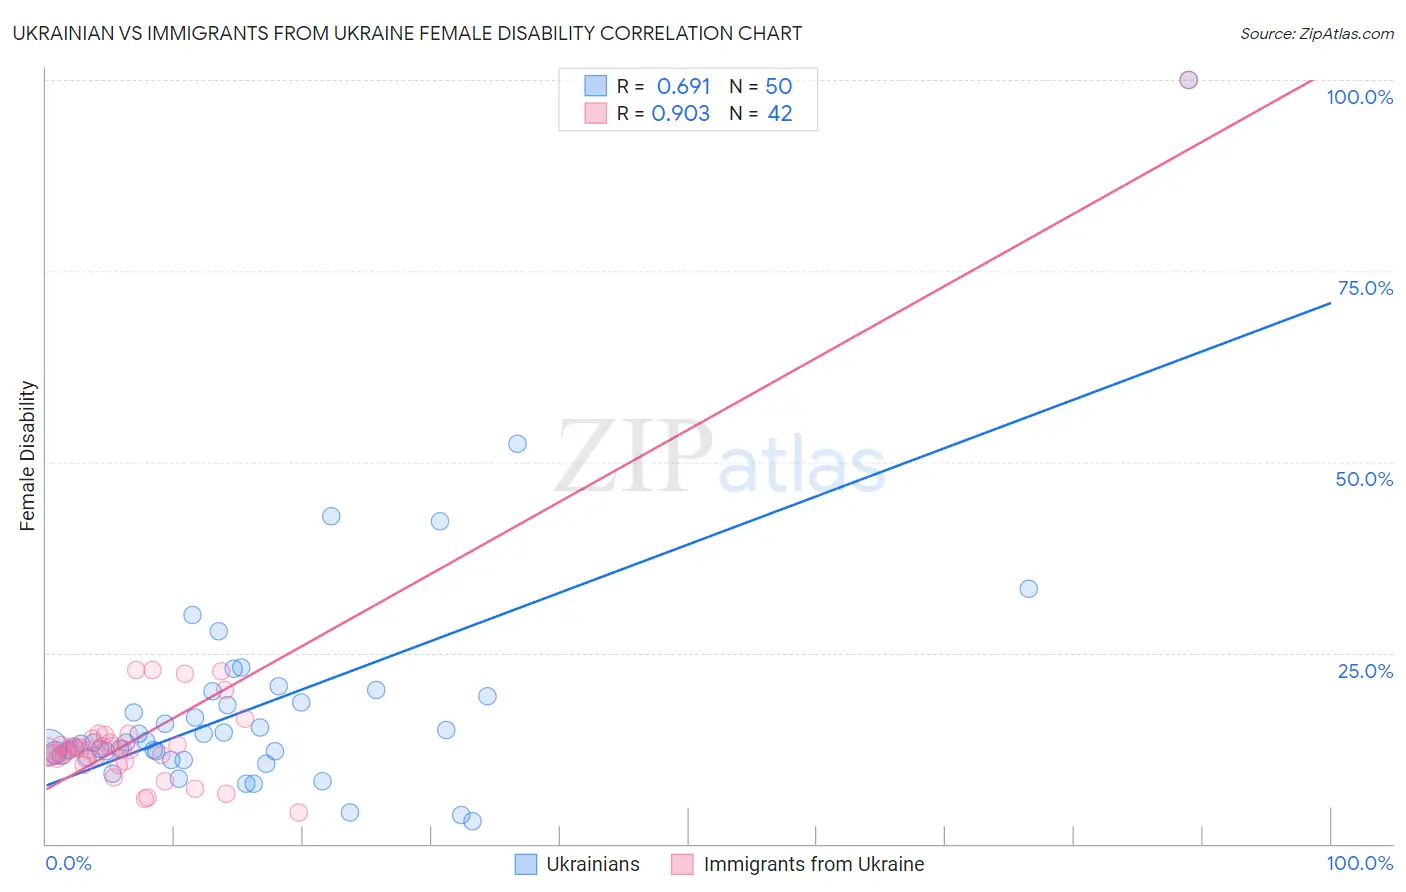
Ukrainian vs Immigrants from Ukraine Female Disability Correlation Chart
The statistical analysis conducted on geographies consisting of 448,602,757 people shows a significant positive correlation between the proportion of Ukrainians and percentage of females with a disability in the United States with a correlation coefficient (R) of 0.691 and weighted average of 12.3%. Similarly, the statistical analysis conducted on geographies consisting of 289,686,189 people shows a near-perfect positive correlation between the proportion of Immigrants from Ukraine and percentage of females with a disability in the United States with a correlation coefficient (R) of 0.903 and weighted average of 12.1%, a difference of 1.5%.
Female Disability Correlation Summary
| Measurement | Ukrainian | Immigrants from Ukraine |
| Minimum | 2.9% | 4.1% |
| Maximum | 100.0% | 100.0% |
| Range | 97.1% | 95.9% |
| Mean | 18.0% | 14.7% |
| Median | 13.3% | 12.4% |
| Interquartile 25% (IQ1) | 11.6% | 11.1% |
| Interquartile 75% (IQ3) | 19.4% | 13.7% |
| Interquartile Range (IQR) | 7.7% | 2.6% |
| Standard Deviation (Sample) | 15.3% | 14.2% |
| Standard Deviation (Population) | 15.1% | 14.0% |
Similar Demographics by Female Disability
Demographics Similar to Ukrainians by Female Disability
In terms of female disability, the demographic groups most similar to Ukrainians are Northern European (12.3%, a difference of 0.010%), Swedish (12.3%, a difference of 0.030%), Immigrants from Panama (12.3%, a difference of 0.080%), Honduran (12.3%, a difference of 0.080%), and Immigrants from Western Africa (12.3%, a difference of 0.090%).
| Demographics | Rating | Rank | Female Disability |
| Serbians | 33.1 /100 | #187 | Fair 12.3% |
| Immigrants | North America | 32.8 /100 | #188 | Fair 12.3% |
| Immigrants | Albania | 31.6 /100 | #189 | Fair 12.3% |
| Immigrants | Honduras | 31.3 /100 | #190 | Fair 12.3% |
| Armenians | 29.7 /100 | #191 | Fair 12.3% |
| Immigrants | Western Africa | 29.2 /100 | #192 | Fair 12.3% |
| Northern Europeans | 27.5 /100 | #193 | Fair 12.3% |
| Ukrainians | 27.2 /100 | #194 | Fair 12.3% |
| Swedes | 26.6 /100 | #195 | Fair 12.3% |
| Immigrants | Panama | 25.5 /100 | #196 | Fair 12.3% |
| Hondurans | 25.4 /100 | #197 | Fair 12.3% |
| Mexican American Indians | 24.9 /100 | #198 | Fair 12.3% |
| Immigrants | Trinidad and Tobago | 24.7 /100 | #199 | Fair 12.3% |
| Trinidadians and Tobagonians | 22.4 /100 | #200 | Fair 12.3% |
| Chinese | 22.1 /100 | #201 | Fair 12.3% |
Demographics Similar to Immigrants from Ukraine by Female Disability
In terms of female disability, the demographic groups most similar to Immigrants from Ukraine are Guyanese (12.1%, a difference of 0.010%), Guatemalan (12.1%, a difference of 0.020%), Czech (12.1%, a difference of 0.030%), Immigrants from Guatemala (12.1%, a difference of 0.070%), and Immigrants from Oceania (12.1%, a difference of 0.10%).
| Demographics | Rating | Rank | Female Disability |
| Ghanaians | 76.6 /100 | #155 | Good 12.1% |
| Moroccans | 72.9 /100 | #156 | Good 12.1% |
| Danes | 72.5 /100 | #157 | Good 12.1% |
| Immigrants | Middle Africa | 72.4 /100 | #158 | Good 12.1% |
| Immigrants | Central America | 67.7 /100 | #159 | Good 12.1% |
| Immigrants | Guatemala | 66.0 /100 | #160 | Good 12.1% |
| Guyanese | 64.7 /100 | #161 | Good 12.1% |
| Immigrants | Ukraine | 64.3 /100 | #162 | Good 12.1% |
| Guatemalans | 63.8 /100 | #163 | Good 12.1% |
| Czechs | 63.6 /100 | #164 | Good 12.1% |
| Immigrants | Oceania | 61.8 /100 | #165 | Good 12.1% |
| Lithuanians | 59.5 /100 | #166 | Average 12.2% |
| Immigrants | Latin America | 59.0 /100 | #167 | Average 12.2% |
| Immigrants | Haiti | 58.8 /100 | #168 | Average 12.2% |
| Lebanese | 58.1 /100 | #169 | Average 12.2% |