Uruguayan vs Immigrants from Zaire Disability Age 65 to 74
COMPARE
Uruguayan
Immigrants from Zaire
Disability Age 65 to 74
Disability Age 65 to 74 Comparison
Uruguayans
Immigrants from Zaire
22.2%
DISABILITY AGE 65 TO 74
96.5/ 100
METRIC RATING
100th/ 347
METRIC RANK
24.3%
DISABILITY AGE 65 TO 74
5.0/ 100
METRIC RATING
232nd/ 347
METRIC RANK
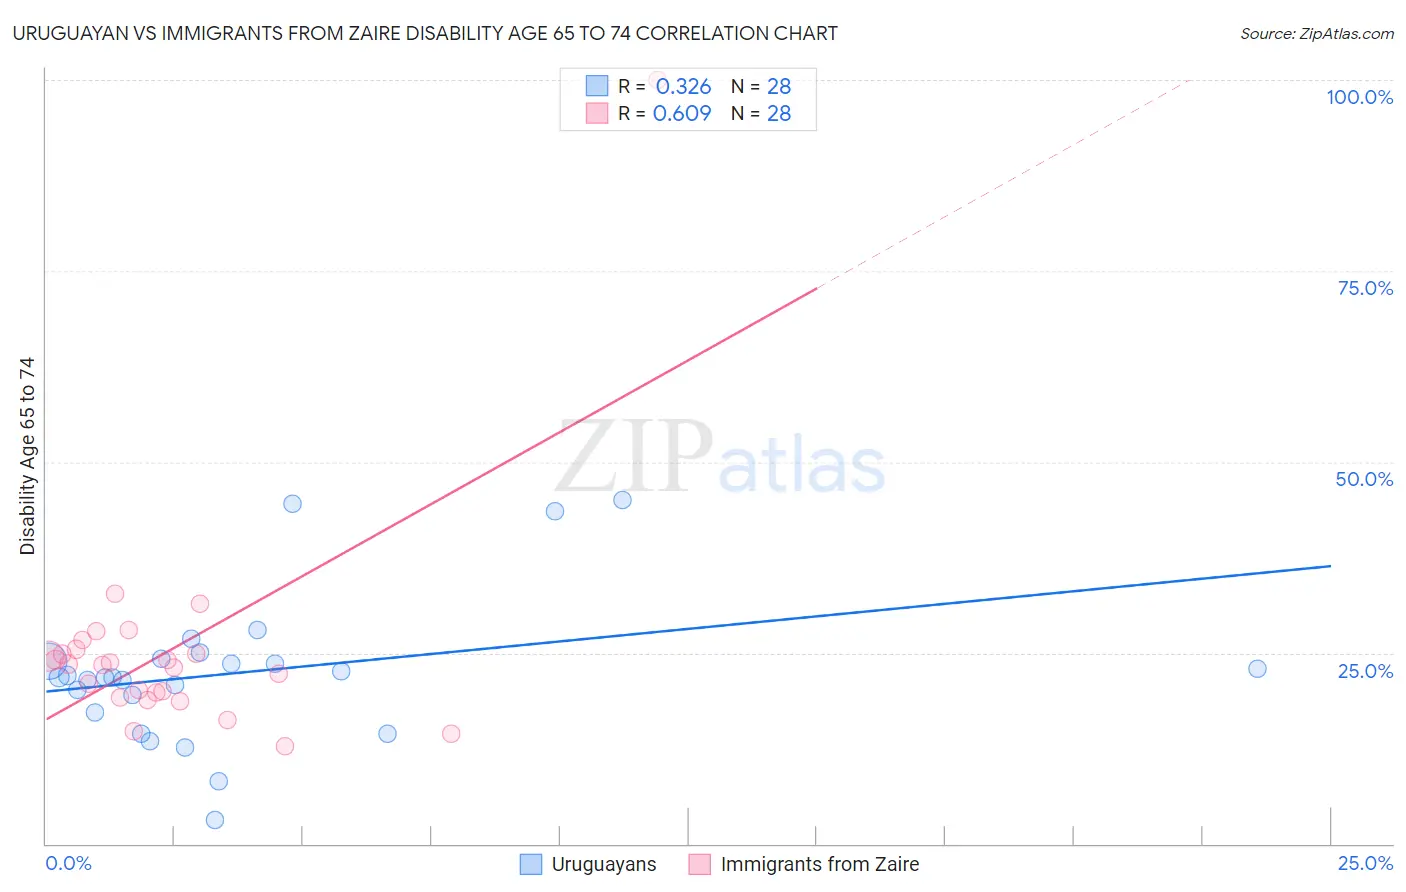
Uruguayan vs Immigrants from Zaire Disability Age 65 to 74 Correlation Chart
The statistical analysis conducted on geographies consisting of 144,726,285 people shows a mild positive correlation between the proportion of Uruguayans and percentage of population with a disability between the ages 65 and 75 in the United States with a correlation coefficient (R) of 0.326 and weighted average of 22.2%. Similarly, the statistical analysis conducted on geographies consisting of 107,234,290 people shows a significant positive correlation between the proportion of Immigrants from Zaire and percentage of population with a disability between the ages 65 and 75 in the United States with a correlation coefficient (R) of 0.609 and weighted average of 24.3%, a difference of 9.6%.
Disability Age 65 to 74 Correlation Summary
| Measurement | Uruguayan | Immigrants from Zaire |
| Minimum | 3.0% | 12.7% |
| Maximum | 45.0% | 100.0% |
| Range | 42.0% | 87.3% |
| Mean | 22.4% | 25.2% |
| Median | 21.8% | 23.5% |
| Interquartile 25% (IQ1) | 18.3% | 19.5% |
| Interquartile 75% (IQ3) | 24.1% | 25.1% |
| Interquartile Range (IQR) | 5.8% | 5.7% |
| Standard Deviation (Sample) | 9.5% | 15.4% |
| Standard Deviation (Population) | 9.3% | 15.1% |
Similar Demographics by Disability Age 65 to 74
Demographics Similar to Uruguayans by Disability Age 65 to 74
In terms of disability age 65 to 74, the demographic groups most similar to Uruguayans are Immigrants from England (22.2%, a difference of 0.020%), Immigrants from Saudi Arabia (22.2%, a difference of 0.040%), South American (22.2%, a difference of 0.060%), Colombian (22.2%, a difference of 0.070%), and Palestinian (22.2%, a difference of 0.12%).
| Demographics | Rating | Rank | Disability Age 65 to 74 |
| Immigrants | Canada | 97.8 /100 | #93 | Exceptional 22.1% |
| Immigrants | Chile | 97.7 /100 | #94 | Exceptional 22.1% |
| Romanians | 97.7 /100 | #95 | Exceptional 22.1% |
| Immigrants | North America | 97.5 /100 | #96 | Exceptional 22.1% |
| Immigrants | Southern Europe | 97.2 /100 | #97 | Exceptional 22.1% |
| Jordanians | 96.9 /100 | #98 | Exceptional 22.2% |
| Immigrants | Colombia | 96.8 /100 | #99 | Exceptional 22.2% |
| Uruguayans | 96.5 /100 | #100 | Exceptional 22.2% |
| Immigrants | England | 96.5 /100 | #101 | Exceptional 22.2% |
| Immigrants | Saudi Arabia | 96.4 /100 | #102 | Exceptional 22.2% |
| South Americans | 96.4 /100 | #103 | Exceptional 22.2% |
| Colombians | 96.4 /100 | #104 | Exceptional 22.2% |
| Palestinians | 96.3 /100 | #105 | Exceptional 22.2% |
| Peruvians | 96.1 /100 | #106 | Exceptional 22.2% |
| Slovenes | 96.1 /100 | #107 | Exceptional 22.2% |
Demographics Similar to Immigrants from Zaire by Disability Age 65 to 74
In terms of disability age 65 to 74, the demographic groups most similar to Immigrants from Zaire are Immigrants from Thailand (24.3%, a difference of 0.050%), Bahamian (24.4%, a difference of 0.16%), Barbadian (24.3%, a difference of 0.25%), Panamanian (24.4%, a difference of 0.27%), and Celtic (24.2%, a difference of 0.36%).
| Demographics | Rating | Rank | Disability Age 65 to 74 |
| Bermudans | 8.2 /100 | #225 | Tragic 24.2% |
| Iraqis | 8.1 /100 | #226 | Tragic 24.2% |
| Nigerians | 7.8 /100 | #227 | Tragic 24.2% |
| Whites/Caucasians | 6.6 /100 | #228 | Tragic 24.2% |
| Celtics | 6.4 /100 | #229 | Tragic 24.2% |
| Barbadians | 6.0 /100 | #230 | Tragic 24.3% |
| Immigrants | Thailand | 5.2 /100 | #231 | Tragic 24.3% |
| Immigrants | Zaire | 5.0 /100 | #232 | Tragic 24.3% |
| Bahamians | 4.5 /100 | #233 | Tragic 24.4% |
| Panamanians | 4.2 /100 | #234 | Tragic 24.4% |
| Scotch-Irish | 3.8 /100 | #235 | Tragic 24.4% |
| German Russians | 3.7 /100 | #236 | Tragic 24.4% |
| West Indians | 3.4 /100 | #237 | Tragic 24.5% |
| Immigrants | Ghana | 3.0 /100 | #238 | Tragic 24.5% |
| Immigrants | Caribbean | 2.6 /100 | #239 | Tragic 24.6% |