Yakama vs Ute Disability Age 65 to 74
COMPARE
Yakama
Ute
Disability Age 65 to 74
Disability Age 65 to 74 Comparison
Yakama
Ute
29.6%
DISABILITY AGE 65 TO 74
0.0/ 100
METRIC RATING
326th/ 347
METRIC RANK
27.3%
DISABILITY AGE 65 TO 74
0.0/ 100
METRIC RATING
307th/ 347
METRIC RANK
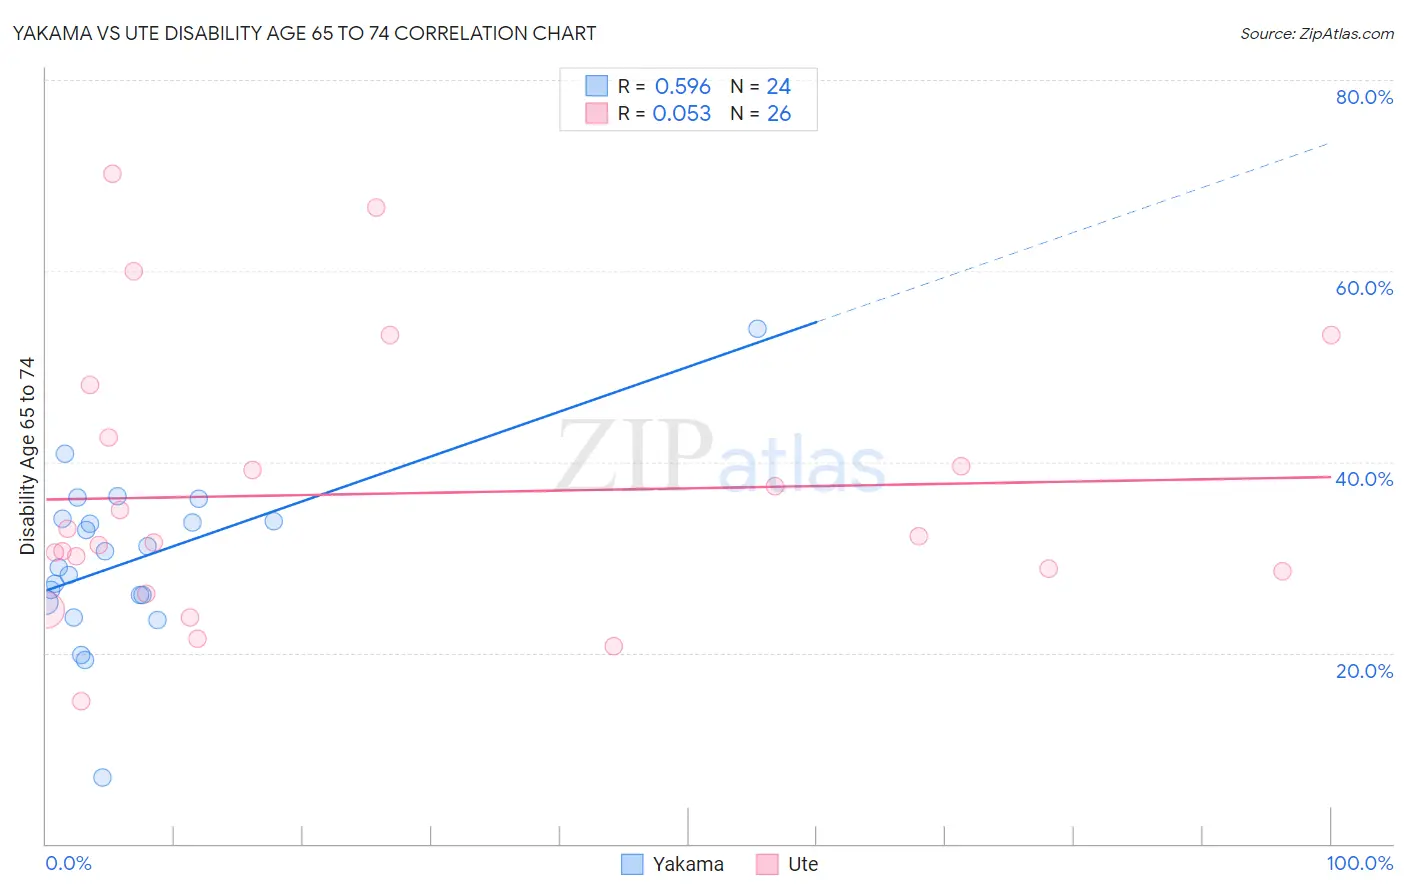
Yakama vs Ute Disability Age 65 to 74 Correlation Chart
The statistical analysis conducted on geographies consisting of 19,894,634 people shows a substantial positive correlation between the proportion of Yakama and percentage of population with a disability between the ages 65 and 75 in the United States with a correlation coefficient (R) of 0.596 and weighted average of 29.6%. Similarly, the statistical analysis conducted on geographies consisting of 55,653,837 people shows a slight positive correlation between the proportion of Ute and percentage of population with a disability between the ages 65 and 75 in the United States with a correlation coefficient (R) of 0.053 and weighted average of 27.3%, a difference of 8.5%.
Disability Age 65 to 74 Correlation Summary
| Measurement | Yakama | Ute |
| Minimum | 7.0% | 14.9% |
| Maximum | 54.0% | 70.2% |
| Range | 47.0% | 55.4% |
| Mean | 29.8% | 36.7% |
| Median | 29.8% | 31.9% |
| Interquartile 25% (IQ1) | 25.6% | 28.6% |
| Interquartile 75% (IQ3) | 33.9% | 42.5% |
| Interquartile Range (IQR) | 8.3% | 13.9% |
| Standard Deviation (Sample) | 8.8% | 14.2% |
| Standard Deviation (Population) | 8.6% | 13.9% |
Demographics Similar to Yakama and Ute by Disability Age 65 to 74
In terms of disability age 65 to 74, the demographic groups most similar to Yakama are Dutch West Indian (29.6%, a difference of 0.23%), Seminole (29.4%, a difference of 0.68%), Puerto Rican (29.1%, a difference of 1.7%), Aleut (28.4%, a difference of 4.2%), and Comanche (28.3%, a difference of 4.5%). Similarly, the demographic groups most similar to Ute are Black/African American (27.3%, a difference of 0.060%), Sioux (27.3%, a difference of 0.15%), Yaqui (27.4%, a difference of 0.21%), Shoshone (27.4%, a difference of 0.26%), and Menominee (27.4%, a difference of 0.49%).
| Demographics | Rating | Rank | Disability Age 65 to 74 |
| Blacks/African Americans | 0.0 /100 | #306 | Tragic 27.3% |
| Ute | 0.0 /100 | #307 | Tragic 27.3% |
| Sioux | 0.0 /100 | #308 | Tragic 27.3% |
| Yaqui | 0.0 /100 | #309 | Tragic 27.4% |
| Shoshone | 0.0 /100 | #310 | Tragic 27.4% |
| Menominee | 0.0 /100 | #311 | Tragic 27.4% |
| Osage | 0.0 /100 | #312 | Tragic 27.5% |
| Paiute | 0.0 /100 | #313 | Tragic 27.8% |
| Chippewa | 0.0 /100 | #314 | Tragic 27.8% |
| Cajuns | 0.0 /100 | #315 | Tragic 27.9% |
| Crow | 0.0 /100 | #316 | Tragic 27.9% |
| Immigrants | Armenia | 0.0 /100 | #317 | Tragic 28.0% |
| Nepalese | 0.0 /100 | #318 | Tragic 28.0% |
| Arapaho | 0.0 /100 | #319 | Tragic 28.1% |
| Cherokee | 0.0 /100 | #320 | Tragic 28.2% |
| Comanche | 0.0 /100 | #321 | Tragic 28.3% |
| Aleuts | 0.0 /100 | #322 | Tragic 28.4% |
| Puerto Ricans | 0.0 /100 | #323 | Tragic 29.1% |
| Seminole | 0.0 /100 | #324 | Tragic 29.4% |
| Dutch West Indians | 0.0 /100 | #325 | Tragic 29.6% |
| Yakama | 0.0 /100 | #326 | Tragic 29.6% |