African vs Spanish American 9th Grade
COMPARE
African
Spanish American
9th Grade
9th Grade Comparison
Africans
Spanish Americans
94.5%
9TH GRADE
9.0/ 100
METRIC RATING
219th/ 347
METRIC RANK
94.2%
9TH GRADE
2.6/ 100
METRIC RATING
241st/ 347
METRIC RANK
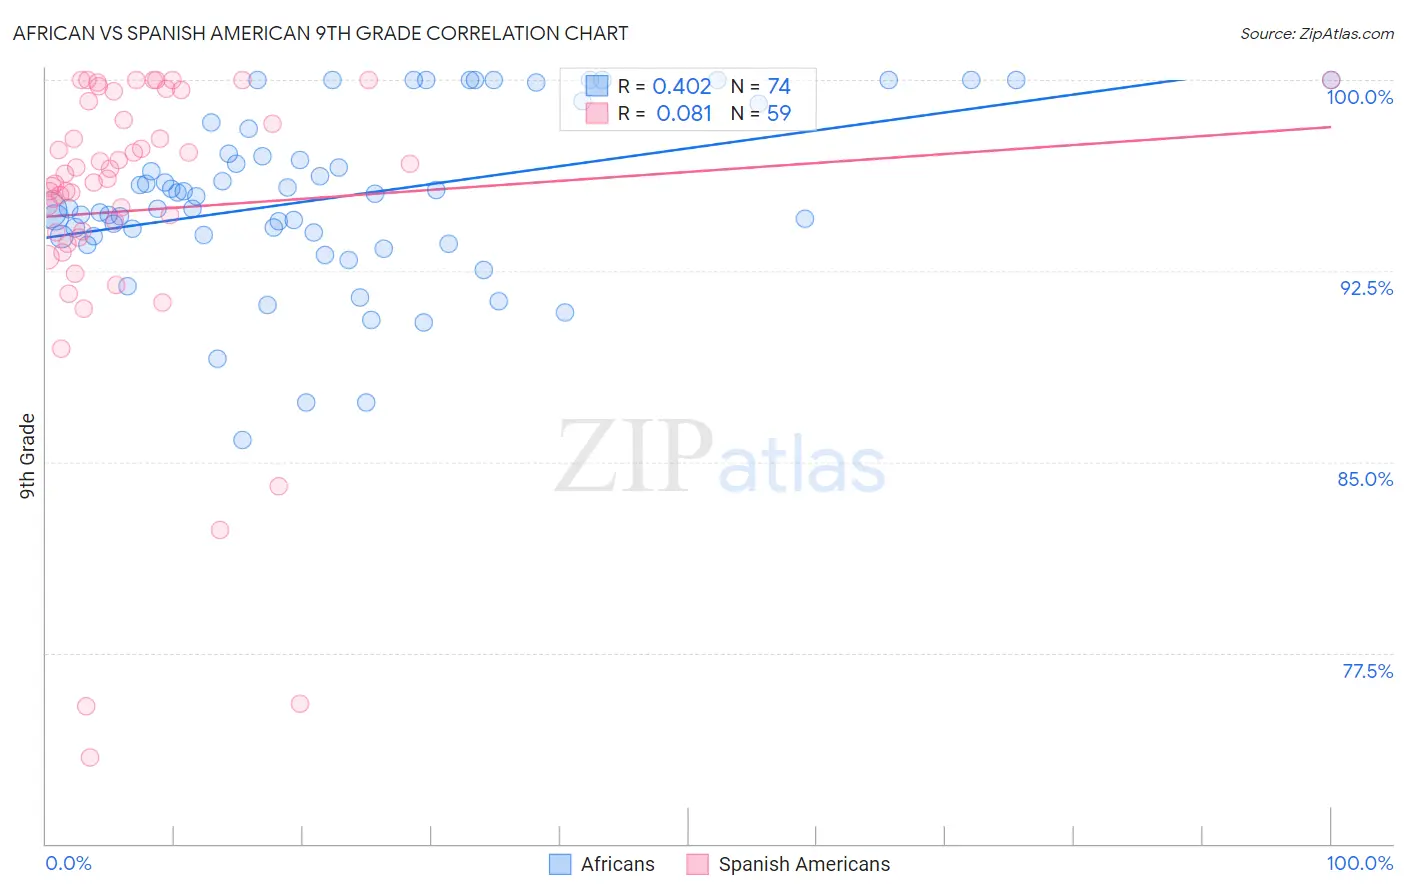
African vs Spanish American 9th Grade Correlation Chart
The statistical analysis conducted on geographies consisting of 470,094,658 people shows a moderate positive correlation between the proportion of Africans and percentage of population with at least 9th grade education in the United States with a correlation coefficient (R) of 0.402 and weighted average of 94.5%. Similarly, the statistical analysis conducted on geographies consisting of 103,168,542 people shows a slight positive correlation between the proportion of Spanish Americans and percentage of population with at least 9th grade education in the United States with a correlation coefficient (R) of 0.081 and weighted average of 94.2%, a difference of 0.24%.
9th Grade Correlation Summary
| Measurement | African | Spanish American |
| Minimum | 85.8% | 73.4% |
| Maximum | 100.0% | 100.0% |
| Range | 14.2% | 26.6% |
| Mean | 95.4% | 94.9% |
| Median | 95.2% | 96.1% |
| Interquartile 25% (IQ1) | 93.9% | 93.8% |
| Interquartile 75% (IQ3) | 98.1% | 99.2% |
| Interquartile Range (IQR) | 4.2% | 5.3% |
| Standard Deviation (Sample) | 3.3% | 5.9% |
| Standard Deviation (Population) | 3.3% | 5.9% |
Similar Demographics by 9th Grade
Demographics Similar to Africans by 9th Grade
In terms of 9th grade, the demographic groups most similar to Africans are Portuguese (94.5%, a difference of 0.0%), Indian (Asian) (94.5%, a difference of 0.010%), Asian (94.5%, a difference of 0.020%), Immigrants from Eastern Africa (94.5%, a difference of 0.020%), and Immigrants from Asia (94.4%, a difference of 0.030%).
| Demographics | Rating | Rank | 9th Grade |
| Immigrants | Malaysia | 12.2 /100 | #212 | Poor 94.5% |
| Immigrants | Oceania | 12.1 /100 | #213 | Poor 94.5% |
| Immigrants | Liberia | 11.8 /100 | #214 | Poor 94.5% |
| Immigrants | Syria | 11.0 /100 | #215 | Poor 94.5% |
| Immigrants | Western Asia | 10.7 /100 | #216 | Poor 94.5% |
| Asians | 9.9 /100 | #217 | Tragic 94.5% |
| Portuguese | 9.2 /100 | #218 | Tragic 94.5% |
| Africans | 9.0 /100 | #219 | Tragic 94.5% |
| Indians (Asian) | 8.6 /100 | #220 | Tragic 94.5% |
| Immigrants | Eastern Africa | 8.2 /100 | #221 | Tragic 94.5% |
| Immigrants | Asia | 7.7 /100 | #222 | Tragic 94.4% |
| Bahamians | 7.0 /100 | #223 | Tragic 94.4% |
| Tongans | 6.0 /100 | #224 | Tragic 94.4% |
| Ethiopians | 5.4 /100 | #225 | Tragic 94.4% |
| Sub-Saharan Africans | 5.4 /100 | #226 | Tragic 94.4% |
Demographics Similar to Spanish Americans by 9th Grade
In terms of 9th grade, the demographic groups most similar to Spanish Americans are Immigrants from Ethiopia (94.3%, a difference of 0.0%), South American Indian (94.3%, a difference of 0.010%), Immigrants from China (94.3%, a difference of 0.010%), Somali (94.3%, a difference of 0.020%), and Korean (94.3%, a difference of 0.020%).
| Demographics | Rating | Rank | 9th Grade |
| Costa Ricans | 3.5 /100 | #234 | Tragic 94.3% |
| Bolivians | 3.3 /100 | #235 | Tragic 94.3% |
| Somalis | 2.9 /100 | #236 | Tragic 94.3% |
| Koreans | 2.9 /100 | #237 | Tragic 94.3% |
| South American Indians | 2.8 /100 | #238 | Tragic 94.3% |
| Immigrants | China | 2.8 /100 | #239 | Tragic 94.3% |
| Immigrants | Ethiopia | 2.7 /100 | #240 | Tragic 94.3% |
| Spanish Americans | 2.6 /100 | #241 | Tragic 94.2% |
| Immigrants | Middle Africa | 2.2 /100 | #242 | Tragic 94.2% |
| Immigrants | Cameroon | 2.1 /100 | #243 | Tragic 94.2% |
| Dutch West Indians | 2.0 /100 | #244 | Tragic 94.2% |
| Paiute | 1.9 /100 | #245 | Tragic 94.2% |
| Senegalese | 1.9 /100 | #246 | Tragic 94.2% |
| Afghans | 1.8 /100 | #247 | Tragic 94.2% |
| Immigrants | Somalia | 1.4 /100 | #248 | Tragic 94.1% |