Alaska Native vs Immigrants from Dominican Republic Doctorate Degree
COMPARE
Alaska Native
Immigrants from Dominican Republic
Doctorate Degree
Doctorate Degree Comparison
Alaska Natives
Immigrants from Dominican Republic
1.4%
DOCTORATE DEGREE
0.3/ 100
METRIC RATING
292nd/ 347
METRIC RANK
1.3%
DOCTORATE DEGREE
0.0/ 100
METRIC RATING
334th/ 347
METRIC RANK
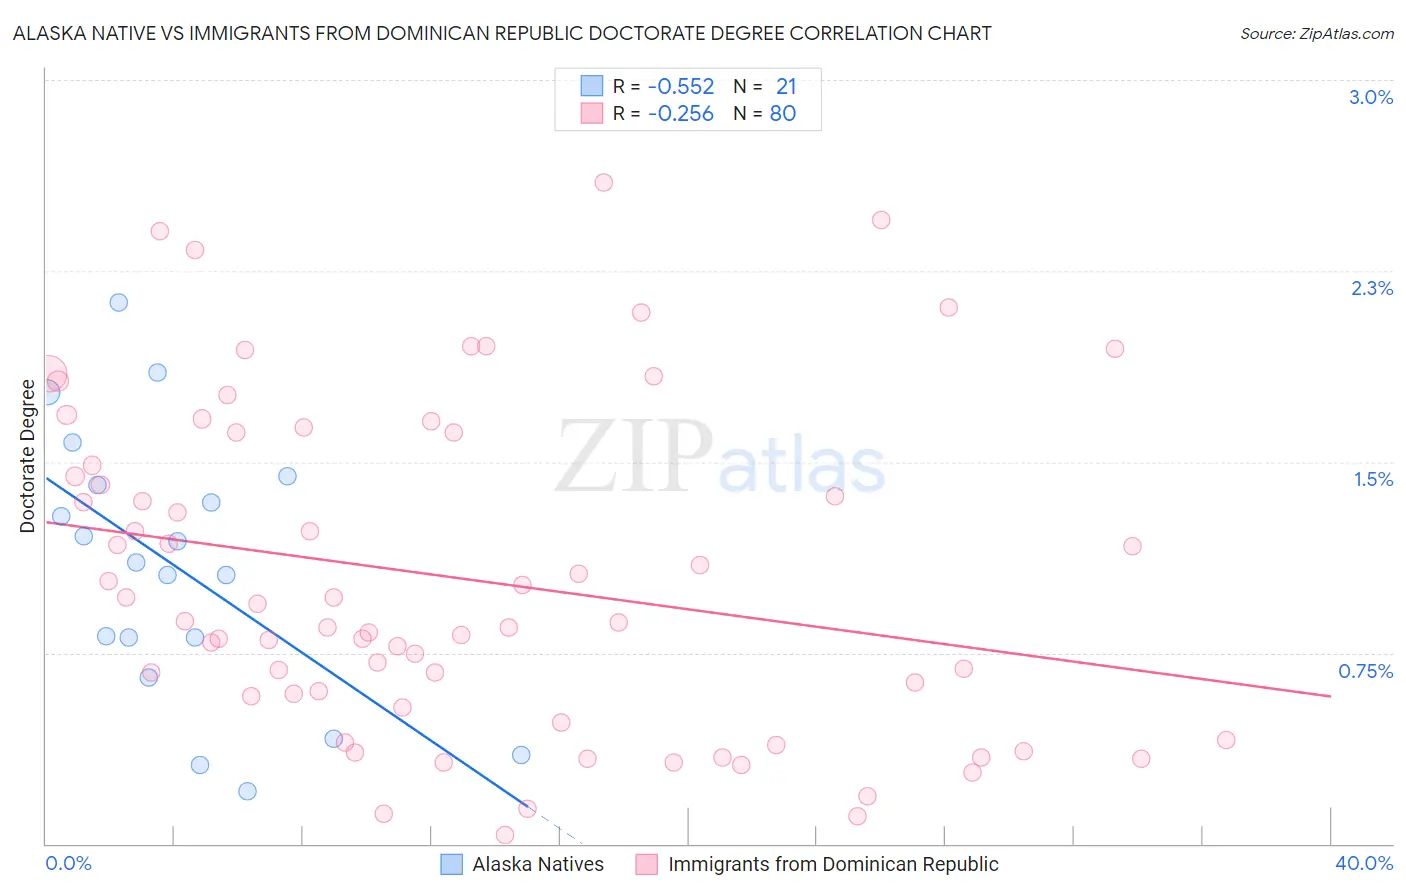
Alaska Native vs Immigrants from Dominican Republic Doctorate Degree Correlation Chart
The statistical analysis conducted on geographies consisting of 76,370,977 people shows a substantial negative correlation between the proportion of Alaska Natives and percentage of population with at least doctorate degree education in the United States with a correlation coefficient (R) of -0.552 and weighted average of 1.4%. Similarly, the statistical analysis conducted on geographies consisting of 273,260,616 people shows a weak negative correlation between the proportion of Immigrants from Dominican Republic and percentage of population with at least doctorate degree education in the United States with a correlation coefficient (R) of -0.256 and weighted average of 1.3%, a difference of 12.6%.
Doctorate Degree Correlation Summary
| Measurement | Alaska Native | Immigrants from Dominican Republic |
| Minimum | 0.21% | 0.033% |
| Maximum | 2.1% | 2.6% |
| Range | 1.9% | 2.6% |
| Mean | 1.1% | 1.0% |
| Median | 1.1% | 0.87% |
| Interquartile 25% (IQ1) | 0.73% | 0.56% |
| Interquartile 75% (IQ3) | 1.4% | 1.5% |
| Interquartile Range (IQR) | 0.69% | 0.99% |
| Standard Deviation (Sample) | 0.53% | 0.64% |
| Standard Deviation (Population) | 0.51% | 0.64% |
Similar Demographics by Doctorate Degree
Demographics Similar to Alaska Natives by Doctorate Degree
In terms of doctorate degree, the demographic groups most similar to Alaska Natives are Black/African American (1.4%, a difference of 0.17%), Choctaw (1.4%, a difference of 0.40%), Cape Verdean (1.4%, a difference of 0.42%), Immigrants from El Salvador (1.4%, a difference of 0.55%), and Immigrants from Yemen (1.4%, a difference of 0.59%).
| Demographics | Rating | Rank | Doctorate Degree |
| Malaysians | 0.3 /100 | #285 | Tragic 1.5% |
| Cherokee | 0.3 /100 | #286 | Tragic 1.5% |
| Cajuns | 0.3 /100 | #287 | Tragic 1.5% |
| Immigrants | El Salvador | 0.3 /100 | #288 | Tragic 1.4% |
| Cape Verdeans | 0.3 /100 | #289 | Tragic 1.4% |
| Choctaw | 0.3 /100 | #290 | Tragic 1.4% |
| Blacks/African Americans | 0.3 /100 | #291 | Tragic 1.4% |
| Alaska Natives | 0.3 /100 | #292 | Tragic 1.4% |
| Immigrants | Yemen | 0.2 /100 | #293 | Tragic 1.4% |
| Samoans | 0.2 /100 | #294 | Tragic 1.4% |
| Guatemalans | 0.2 /100 | #295 | Tragic 1.4% |
| Immigrants | Ecuador | 0.2 /100 | #296 | Tragic 1.4% |
| Tsimshian | 0.2 /100 | #297 | Tragic 1.4% |
| Puerto Ricans | 0.1 /100 | #298 | Tragic 1.4% |
| Belizeans | 0.1 /100 | #299 | Tragic 1.4% |
Demographics Similar to Immigrants from Dominican Republic by Doctorate Degree
In terms of doctorate degree, the demographic groups most similar to Immigrants from Dominican Republic are Immigrants from Caribbean (1.3%, a difference of 0.19%), Yakama (1.3%, a difference of 0.35%), Immigrants from Haiti (1.3%, a difference of 1.8%), Immigrants from Latin America (1.3%, a difference of 1.9%), and Yup'ik (1.3%, a difference of 1.9%).
| Demographics | Rating | Rank | Doctorate Degree |
| Hispanics or Latinos | 0.0 /100 | #327 | Tragic 1.3% |
| Inupiat | 0.0 /100 | #328 | Tragic 1.3% |
| Haitians | 0.0 /100 | #329 | Tragic 1.3% |
| Yup'ik | 0.0 /100 | #330 | Tragic 1.3% |
| Immigrants | Latin America | 0.0 /100 | #331 | Tragic 1.3% |
| Yakama | 0.0 /100 | #332 | Tragic 1.3% |
| Immigrants | Caribbean | 0.0 /100 | #333 | Tragic 1.3% |
| Immigrants | Dominican Republic | 0.0 /100 | #334 | Tragic 1.3% |
| Immigrants | Haiti | 0.0 /100 | #335 | Tragic 1.3% |
| Nepalese | 0.0 /100 | #336 | Tragic 1.3% |
| Bangladeshis | 0.0 /100 | #337 | Tragic 1.2% |
| Puget Sound Salish | 0.0 /100 | #338 | Tragic 1.2% |
| Immigrants | Central America | 0.0 /100 | #339 | Tragic 1.2% |
| Immigrants | Cuba | 0.0 /100 | #340 | Tragic 1.2% |
| Mexicans | 0.0 /100 | #341 | Tragic 1.2% |