Arapaho vs Immigrants from Eastern Africa 8th Grade
COMPARE
Arapaho
Immigrants from Eastern Africa
8th Grade
8th Grade Comparison
Arapaho
Immigrants from Eastern Africa
96.6%
8TH GRADE
99.5/ 100
METRIC RATING
73rd/ 347
METRIC RANK
95.3%
8TH GRADE
5.6/ 100
METRIC RATING
228th/ 347
METRIC RANK
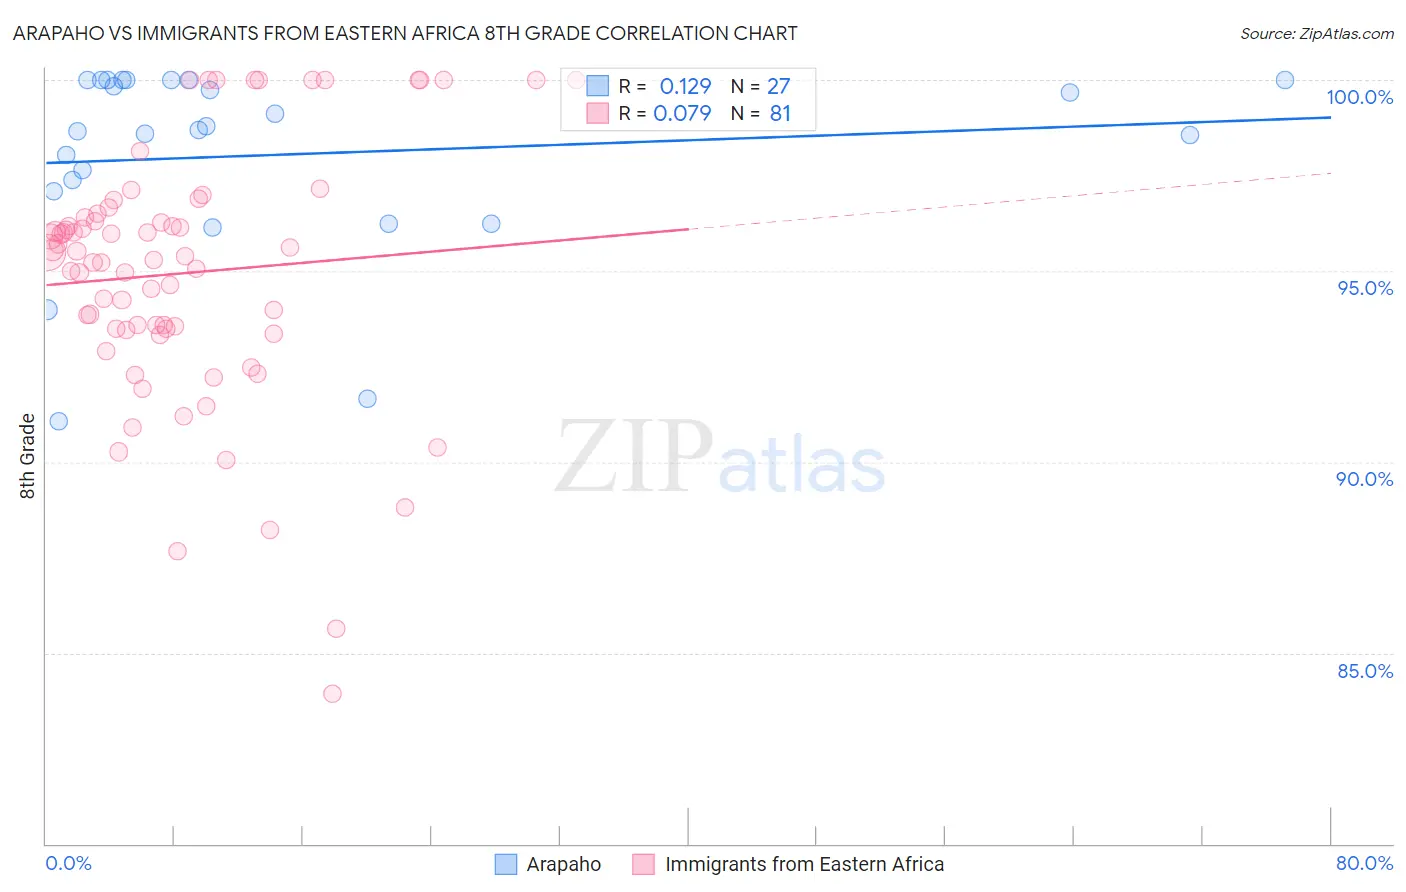
Arapaho vs Immigrants from Eastern Africa 8th Grade Correlation Chart
The statistical analysis conducted on geographies consisting of 29,780,325 people shows a poor positive correlation between the proportion of Arapaho and percentage of population with at least 8th grade education in the United States with a correlation coefficient (R) of 0.129 and weighted average of 96.6%. Similarly, the statistical analysis conducted on geographies consisting of 355,144,184 people shows a slight positive correlation between the proportion of Immigrants from Eastern Africa and percentage of population with at least 8th grade education in the United States with a correlation coefficient (R) of 0.079 and weighted average of 95.3%, a difference of 1.3%.
8th Grade Correlation Summary
| Measurement | Arapaho | Immigrants from Eastern Africa |
| Minimum | 91.1% | 83.9% |
| Maximum | 100.0% | 100.0% |
| Range | 8.9% | 16.1% |
| Mean | 98.0% | 94.9% |
| Median | 98.7% | 95.4% |
| Interquartile 25% (IQ1) | 97.1% | 93.5% |
| Interquartile 75% (IQ3) | 100.0% | 96.5% |
| Interquartile Range (IQR) | 2.9% | 3.0% |
| Standard Deviation (Sample) | 2.5% | 3.3% |
| Standard Deviation (Population) | 2.4% | 3.3% |
Similar Demographics by 8th Grade
Demographics Similar to Arapaho by 8th Grade
In terms of 8th grade, the demographic groups most similar to Arapaho are New Zealander (96.6%, a difference of 0.0%), Immigrants from England (96.6%, a difference of 0.0%), Immigrants from Ireland (96.5%, a difference of 0.010%), Zimbabwean (96.5%, a difference of 0.020%), and Immigrants from Netherlands (96.5%, a difference of 0.020%).
| Demographics | Rating | Rank | 8th Grade |
| Canadians | 99.7 /100 | #66 | Exceptional 96.6% |
| Iranians | 99.7 /100 | #67 | Exceptional 96.6% |
| Creek | 99.7 /100 | #68 | Exceptional 96.6% |
| Americans | 99.7 /100 | #69 | Exceptional 96.6% |
| Immigrants | Lithuania | 99.6 /100 | #70 | Exceptional 96.6% |
| New Zealanders | 99.5 /100 | #71 | Exceptional 96.6% |
| Immigrants | England | 99.5 /100 | #72 | Exceptional 96.6% |
| Arapaho | 99.5 /100 | #73 | Exceptional 96.6% |
| Immigrants | Ireland | 99.5 /100 | #74 | Exceptional 96.5% |
| Zimbabweans | 99.4 /100 | #75 | Exceptional 96.5% |
| Immigrants | Netherlands | 99.4 /100 | #76 | Exceptional 96.5% |
| Cypriots | 99.4 /100 | #77 | Exceptional 96.5% |
| Yugoslavians | 99.4 /100 | #78 | Exceptional 96.5% |
| Puget Sound Salish | 99.3 /100 | #79 | Exceptional 96.5% |
| Delaware | 99.2 /100 | #80 | Exceptional 96.5% |
Demographics Similar to Immigrants from Eastern Africa by 8th Grade
In terms of 8th grade, the demographic groups most similar to Immigrants from Eastern Africa are Bahamian (95.3%, a difference of 0.0%), Immigrants from Western Asia (95.3%, a difference of 0.010%), Subsaharan African (95.3%, a difference of 0.010%), Navajo (95.3%, a difference of 0.010%), and Immigrants from Oceania (95.3%, a difference of 0.040%).
| Demographics | Rating | Rank | 8th Grade |
| Immigrants | Syria | 7.4 /100 | #221 | Tragic 95.3% |
| Immigrants | Malaysia | 7.3 /100 | #222 | Tragic 95.3% |
| Immigrants | Oceania | 7.1 /100 | #223 | Tragic 95.3% |
| Immigrants | Western Asia | 6.0 /100 | #224 | Tragic 95.3% |
| Sub-Saharan Africans | 6.0 /100 | #225 | Tragic 95.3% |
| Navajo | 5.7 /100 | #226 | Tragic 95.3% |
| Bahamians | 5.6 /100 | #227 | Tragic 95.3% |
| Immigrants | Eastern Africa | 5.6 /100 | #228 | Tragic 95.3% |
| Immigrants | Indonesia | 4.4 /100 | #229 | Tragic 95.3% |
| Immigrants | Panama | 4.1 /100 | #230 | Tragic 95.2% |
| Asians | 3.5 /100 | #231 | Tragic 95.2% |
| Indians (Asian) | 3.3 /100 | #232 | Tragic 95.2% |
| Immigrants | Asia | 3.1 /100 | #233 | Tragic 95.2% |
| Costa Ricans | 3.0 /100 | #234 | Tragic 95.2% |
| Nigerians | 2.9 /100 | #235 | Tragic 95.2% |