Arapaho vs Immigrants from Hong Kong 11th Grade
COMPARE
Arapaho
Immigrants from Hong Kong
11th Grade
11th Grade Comparison
Arapaho
Immigrants from Hong Kong
92.4%
11TH GRADE
35.1/ 100
METRIC RATING
186th/ 347
METRIC RANK
92.2%
11TH GRADE
23.3/ 100
METRIC RATING
204th/ 347
METRIC RANK
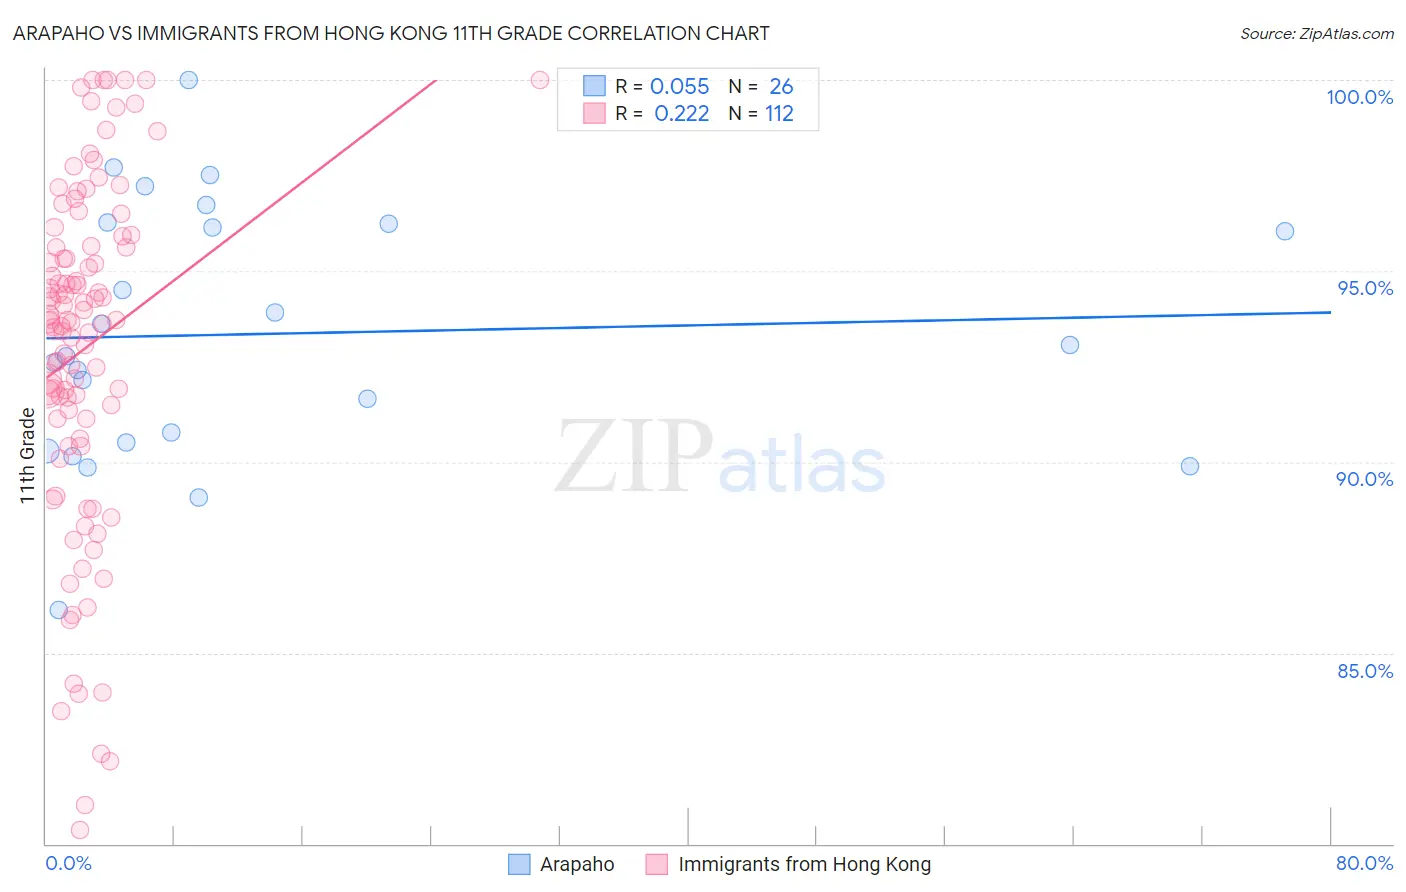
Arapaho vs Immigrants from Hong Kong 11th Grade Correlation Chart
The statistical analysis conducted on geographies consisting of 29,780,040 people shows a slight positive correlation between the proportion of Arapaho and percentage of population with at least 11th grade education in the United States with a correlation coefficient (R) of 0.055 and weighted average of 92.4%. Similarly, the statistical analysis conducted on geographies consisting of 253,990,250 people shows a weak positive correlation between the proportion of Immigrants from Hong Kong and percentage of population with at least 11th grade education in the United States with a correlation coefficient (R) of 0.222 and weighted average of 92.2%, a difference of 0.14%.
11th Grade Correlation Summary
| Measurement | Arapaho | Immigrants from Hong Kong |
| Minimum | 86.1% | 80.4% |
| Maximum | 100.0% | 100.0% |
| Range | 13.9% | 19.6% |
| Mean | 93.4% | 93.0% |
| Median | 92.9% | 93.7% |
| Interquartile 25% (IQ1) | 90.5% | 91.1% |
| Interquartile 75% (IQ3) | 96.2% | 95.6% |
| Interquartile Range (IQR) | 5.7% | 4.5% |
| Standard Deviation (Sample) | 3.3% | 4.5% |
| Standard Deviation (Population) | 3.3% | 4.4% |
Demographics Similar to Arapaho and Immigrants from Hong Kong by 11th Grade
In terms of 11th grade, the demographic groups most similar to Arapaho are Immigrants from Western Asia (92.4%, a difference of 0.0%), Immigrants from Nepal (92.4%, a difference of 0.010%), Immigrants from Indonesia (92.4%, a difference of 0.020%), Immigrants from Chile (92.4%, a difference of 0.020%), and Chickasaw (92.3%, a difference of 0.040%). Similarly, the demographic groups most similar to Immigrants from Hong Kong are Immigrants from Sudan (92.3%, a difference of 0.0%), Kiowa (92.2%, a difference of 0.0%), Immigrants from Eastern Africa (92.3%, a difference of 0.010%), Samoan (92.3%, a difference of 0.020%), and Immigrants from China (92.3%, a difference of 0.020%).
| Demographics | Rating | Rank | 11th Grade |
| Immigrants | Nepal | 36.4 /100 | #185 | Fair 92.4% |
| Arapaho | 35.1 /100 | #186 | Fair 92.4% |
| Immigrants | Western Asia | 35.0 /100 | #187 | Fair 92.4% |
| Immigrants | Indonesia | 33.7 /100 | #188 | Fair 92.4% |
| Immigrants | Chile | 33.3 /100 | #189 | Fair 92.4% |
| Chickasaw | 31.4 /100 | #190 | Fair 92.3% |
| French American Indians | 30.8 /100 | #191 | Fair 92.3% |
| Immigrants | Syria | 30.4 /100 | #192 | Fair 92.3% |
| Moroccans | 28.7 /100 | #193 | Fair 92.3% |
| Sioux | 28.5 /100 | #194 | Fair 92.3% |
| Liberians | 26.8 /100 | #195 | Fair 92.3% |
| Panamanians | 26.4 /100 | #196 | Fair 92.3% |
| Marshallese | 26.0 /100 | #197 | Fair 92.3% |
| Hawaiians | 25.5 /100 | #198 | Fair 92.3% |
| Immigrants | Uganda | 25.2 /100 | #199 | Fair 92.3% |
| Samoans | 25.1 /100 | #200 | Fair 92.3% |
| Immigrants | China | 25.1 /100 | #201 | Fair 92.3% |
| Immigrants | Eastern Africa | 24.1 /100 | #202 | Fair 92.3% |
| Immigrants | Sudan | 23.5 /100 | #203 | Fair 92.3% |
| Immigrants | Hong Kong | 23.3 /100 | #204 | Fair 92.2% |
| Kiowa | 23.2 /100 | #205 | Fair 92.2% |