Asian vs Apache 4th Grade
COMPARE
Asian
Apache
4th Grade
4th Grade Comparison
Asians
Apache
97.1%
4TH GRADE
1.4/ 100
METRIC RATING
242nd/ 347
METRIC RANK
97.6%
4TH GRADE
61.3/ 100
METRIC RATING
160th/ 347
METRIC RANK
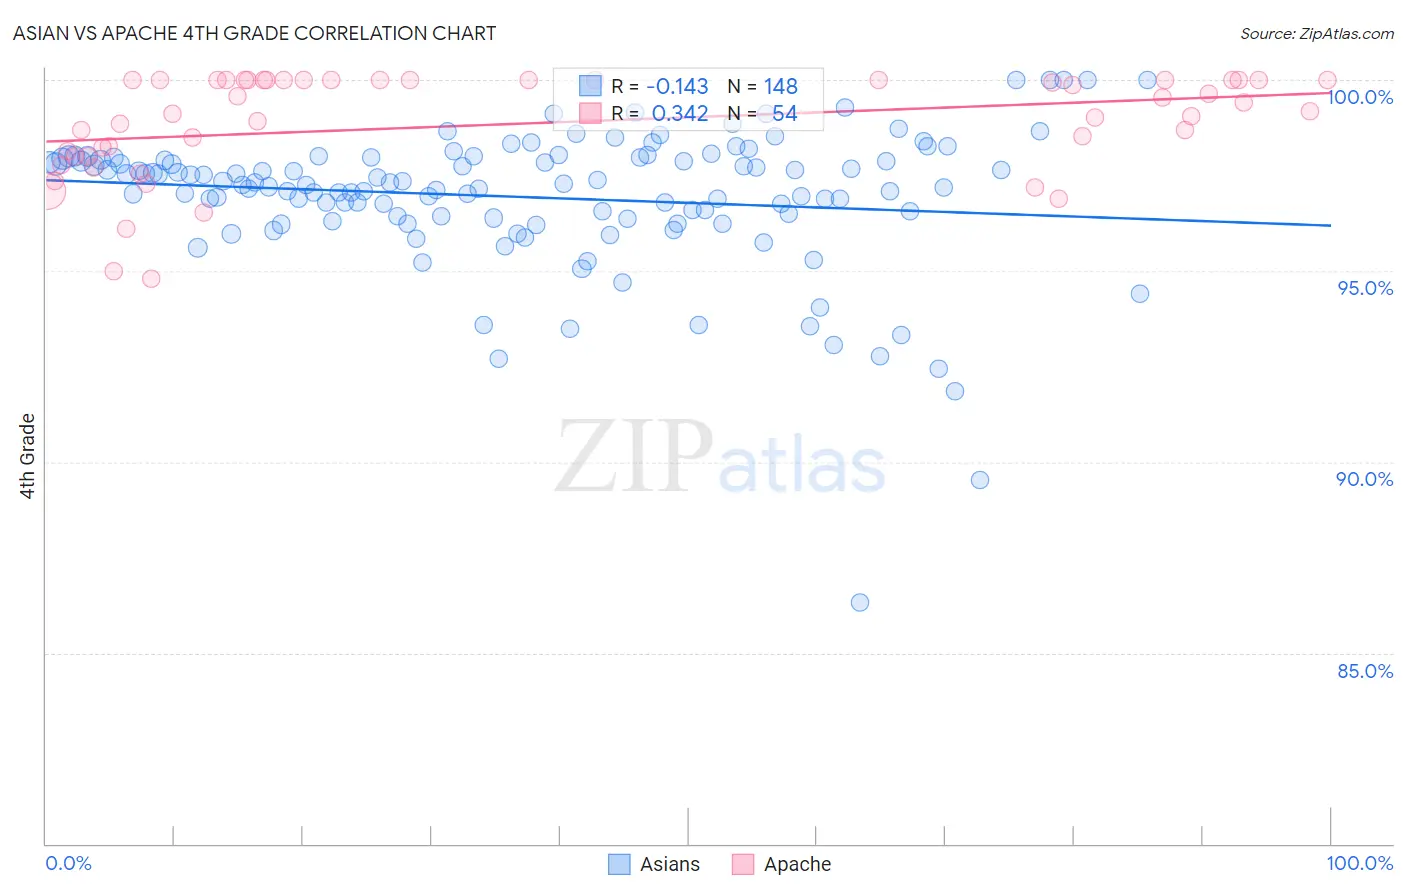
Asian vs Apache 4th Grade Correlation Chart
The statistical analysis conducted on geographies consisting of 550,860,618 people shows a poor negative correlation between the proportion of Asians and percentage of population with at least 4th grade education in the United States with a correlation coefficient (R) of -0.143 and weighted average of 97.1%. Similarly, the statistical analysis conducted on geographies consisting of 231,142,814 people shows a mild positive correlation between the proportion of Apache and percentage of population with at least 4th grade education in the United States with a correlation coefficient (R) of 0.342 and weighted average of 97.6%, a difference of 0.45%.
4th Grade Correlation Summary
| Measurement | Asian | Apache |
| Minimum | 86.3% | 94.8% |
| Maximum | 100.0% | 100.0% |
| Range | 13.7% | 5.2% |
| Mean | 96.9% | 98.9% |
| Median | 97.3% | 99.3% |
| Interquartile 25% (IQ1) | 96.4% | 98.0% |
| Interquartile 75% (IQ3) | 97.9% | 100.0% |
| Interquartile Range (IQR) | 1.5% | 2.0% |
| Standard Deviation (Sample) | 1.9% | 1.4% |
| Standard Deviation (Population) | 1.9% | 1.3% |
Similar Demographics by 4th Grade
Demographics Similar to Asians by 4th Grade
In terms of 4th grade, the demographic groups most similar to Asians are U.S. Virgin Islander (97.1%, a difference of 0.0%), Colombian (97.1%, a difference of 0.010%), Immigrants from Indonesia (97.1%, a difference of 0.010%), Korean (97.1%, a difference of 0.010%), and Immigrants from Eastern Africa (97.1%, a difference of 0.010%).
| Demographics | Rating | Rank | 4th Grade |
| Yuman | 2.9 /100 | #235 | Tragic 97.2% |
| Immigrants | Eastern Asia | 2.7 /100 | #236 | Tragic 97.2% |
| Immigrants | Costa Rica | 2.0 /100 | #237 | Tragic 97.2% |
| Indians (Asian) | 1.9 /100 | #238 | Tragic 97.2% |
| Nigerians | 1.8 /100 | #239 | Tragic 97.1% |
| Colombians | 1.6 /100 | #240 | Tragic 97.1% |
| Immigrants | Indonesia | 1.5 /100 | #241 | Tragic 97.1% |
| Asians | 1.4 /100 | #242 | Tragic 97.1% |
| U.S. Virgin Islanders | 1.4 /100 | #243 | Tragic 97.1% |
| Koreans | 1.3 /100 | #244 | Tragic 97.1% |
| Immigrants | Eastern Africa | 1.2 /100 | #245 | Tragic 97.1% |
| Immigrants | Uruguay | 1.2 /100 | #246 | Tragic 97.1% |
| Ethiopians | 1.2 /100 | #247 | Tragic 97.1% |
| Immigrants | Asia | 1.2 /100 | #248 | Tragic 97.1% |
| Immigrants | Africa | 1.0 /100 | #249 | Tragic 97.1% |
Demographics Similar to Apache by 4th Grade
In terms of 4th grade, the demographic groups most similar to Apache are Marshallese (97.6%, a difference of 0.0%), Bermudan (97.6%, a difference of 0.0%), Immigrants from Iran (97.6%, a difference of 0.0%), Immigrants from Italy (97.6%, a difference of 0.010%), and Ugandan (97.6%, a difference of 0.010%).
| Demographics | Rating | Rank | 4th Grade |
| Immigrants | Eastern Europe | 71.3 /100 | #153 | Good 97.6% |
| Immigrants | Russia | 67.0 /100 | #154 | Good 97.6% |
| Albanians | 67.0 /100 | #155 | Good 97.6% |
| Immigrants | Jordan | 66.9 /100 | #156 | Good 97.6% |
| Immigrants | Bosnia and Herzegovina | 66.0 /100 | #157 | Good 97.6% |
| French American Indians | 65.9 /100 | #158 | Good 97.6% |
| Immigrants | Italy | 63.7 /100 | #159 | Good 97.6% |
| Apache | 61.3 /100 | #160 | Good 97.6% |
| Marshallese | 60.8 /100 | #161 | Good 97.6% |
| Bermudans | 60.5 /100 | #162 | Good 97.6% |
| Immigrants | Iran | 60.3 /100 | #163 | Good 97.6% |
| Ugandans | 58.9 /100 | #164 | Average 97.6% |
| Venezuelans | 58.7 /100 | #165 | Average 97.6% |
| Kenyans | 56.5 /100 | #166 | Average 97.5% |
| Immigrants | Poland | 55.9 /100 | #167 | Average 97.5% |