Assyrian/Chaldean/Syriac vs Mexican American Indian Bachelor's Degree
COMPARE
Assyrian/Chaldean/Syriac
Mexican American Indian
Bachelor's Degree
Bachelor's Degree Comparison
Assyrians/Chaldeans/Syriacs
Mexican American Indians
39.8%
BACHELOR'S DEGREE
89.4/ 100
METRIC RATING
134th/ 347
METRIC RANK
30.2%
BACHELOR'S DEGREE
0.0/ 100
METRIC RATING
302nd/ 347
METRIC RANK
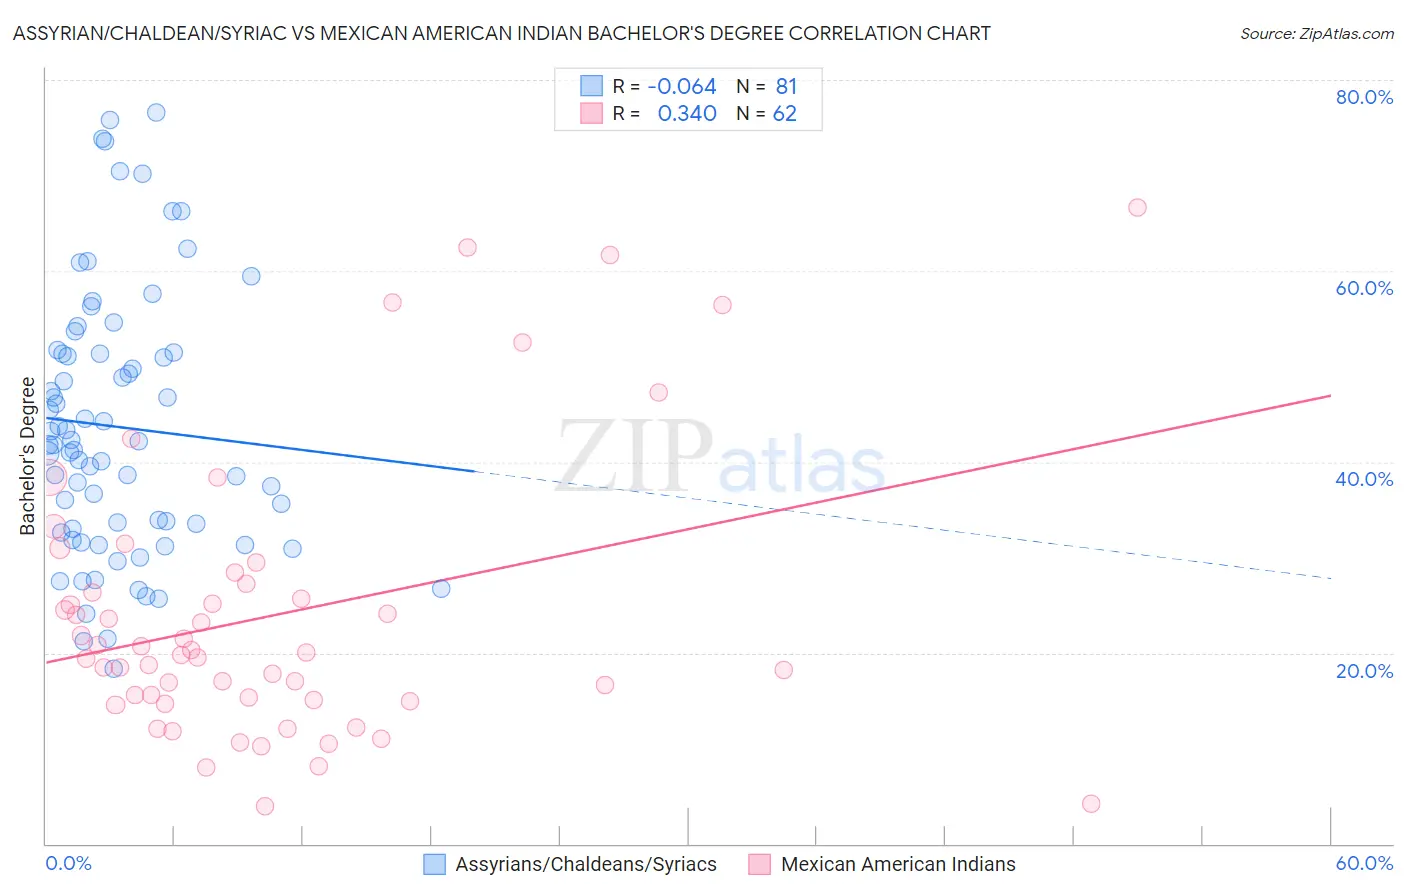
Assyrian/Chaldean/Syriac vs Mexican American Indian Bachelor's Degree Correlation Chart
The statistical analysis conducted on geographies consisting of 110,314,164 people shows a slight negative correlation between the proportion of Assyrians/Chaldeans/Syriacs and percentage of population with at least bachelor's degree education in the United States with a correlation coefficient (R) of -0.064 and weighted average of 39.8%. Similarly, the statistical analysis conducted on geographies consisting of 317,609,381 people shows a mild positive correlation between the proportion of Mexican American Indians and percentage of population with at least bachelor's degree education in the United States with a correlation coefficient (R) of 0.340 and weighted average of 30.2%, a difference of 31.6%.
Bachelor's Degree Correlation Summary
| Measurement | Assyrian/Chaldean/Syriac | Mexican American Indian |
| Minimum | 18.3% | 3.9% |
| Maximum | 76.7% | 66.7% |
| Range | 58.4% | 62.8% |
| Mean | 43.7% | 24.0% |
| Median | 41.8% | 19.9% |
| Interquartile 25% (IQ1) | 32.8% | 15.0% |
| Interquartile 75% (IQ3) | 51.4% | 27.2% |
| Interquartile Range (IQR) | 18.6% | 12.2% |
| Standard Deviation (Sample) | 13.8% | 14.5% |
| Standard Deviation (Population) | 13.7% | 14.4% |
Similar Demographics by Bachelor's Degree
Demographics Similar to Assyrians/Chaldeans/Syriacs by Bachelor's Degree
In terms of bachelor's degree, the demographic groups most similar to Assyrians/Chaldeans/Syriacs are Luxembourger (39.8%, a difference of 0.080%), Pakistani (39.7%, a difference of 0.28%), Immigrants from Southern Europe (40.0%, a difference of 0.43%), Taiwanese (40.0%, a difference of 0.44%), and Icelander (39.5%, a difference of 0.65%).
| Demographics | Rating | Rank | Bachelor's Degree |
| Immigrants | Jordan | 93.4 /100 | #127 | Exceptional 40.3% |
| Immigrants | Venezuela | 92.9 /100 | #128 | Exceptional 40.2% |
| Serbians | 92.4 /100 | #129 | Exceptional 40.1% |
| Sierra Leoneans | 92.2 /100 | #130 | Exceptional 40.1% |
| Italians | 91.9 /100 | #131 | Exceptional 40.1% |
| Taiwanese | 91.1 /100 | #132 | Exceptional 40.0% |
| Immigrants | Southern Europe | 91.1 /100 | #133 | Exceptional 40.0% |
| Assyrians/Chaldeans/Syriacs | 89.4 /100 | #134 | Excellent 39.8% |
| Luxembourgers | 89.1 /100 | #135 | Excellent 39.8% |
| Pakistanis | 88.2 /100 | #136 | Excellent 39.7% |
| Icelanders | 86.5 /100 | #137 | Excellent 39.5% |
| Europeans | 85.6 /100 | #138 | Excellent 39.5% |
| Immigrants | Sudan | 84.5 /100 | #139 | Excellent 39.4% |
| Immigrants | Armenia | 84.1 /100 | #140 | Excellent 39.4% |
| South American Indians | 83.6 /100 | #141 | Excellent 39.3% |
Demographics Similar to Mexican American Indians by Bachelor's Degree
In terms of bachelor's degree, the demographic groups most similar to Mexican American Indians are Bangladeshi (30.2%, a difference of 0.17%), Cherokee (30.2%, a difference of 0.17%), Immigrants from Cuba (30.3%, a difference of 0.28%), Immigrants from Micronesia (30.4%, a difference of 0.49%), and Chickasaw (30.4%, a difference of 0.51%).
| Demographics | Rating | Rank | Bachelor's Degree |
| Immigrants | Dominican Republic | 0.0 /100 | #295 | Tragic 30.7% |
| Puget Sound Salish | 0.0 /100 | #296 | Tragic 30.7% |
| Immigrants | Haiti | 0.0 /100 | #297 | Tragic 30.6% |
| Chippewa | 0.0 /100 | #298 | Tragic 30.6% |
| Chickasaw | 0.0 /100 | #299 | Tragic 30.4% |
| Immigrants | Micronesia | 0.0 /100 | #300 | Tragic 30.4% |
| Immigrants | Cuba | 0.0 /100 | #301 | Tragic 30.3% |
| Mexican American Indians | 0.0 /100 | #302 | Tragic 30.2% |
| Bangladeshis | 0.0 /100 | #303 | Tragic 30.2% |
| Cherokee | 0.0 /100 | #304 | Tragic 30.2% |
| Immigrants | Latin America | 0.0 /100 | #305 | Tragic 30.1% |
| Immigrants | Yemen | 0.0 /100 | #306 | Tragic 29.9% |
| Nepalese | 0.0 /100 | #307 | Tragic 29.9% |
| Cajuns | 0.0 /100 | #308 | Tragic 29.6% |
| Hispanics or Latinos | 0.0 /100 | #309 | Tragic 29.6% |