Australian vs Austrian Doctorate Degree
COMPARE
Australian
Austrian
Doctorate Degree
Doctorate Degree Comparison
Australians
Austrians
2.4%
DOCTORATE DEGREE
100.0/ 100
METRIC RATING
51st/ 347
METRIC RANK
2.1%
DOCTORATE DEGREE
98.0/ 100
METRIC RATING
104th/ 347
METRIC RANK
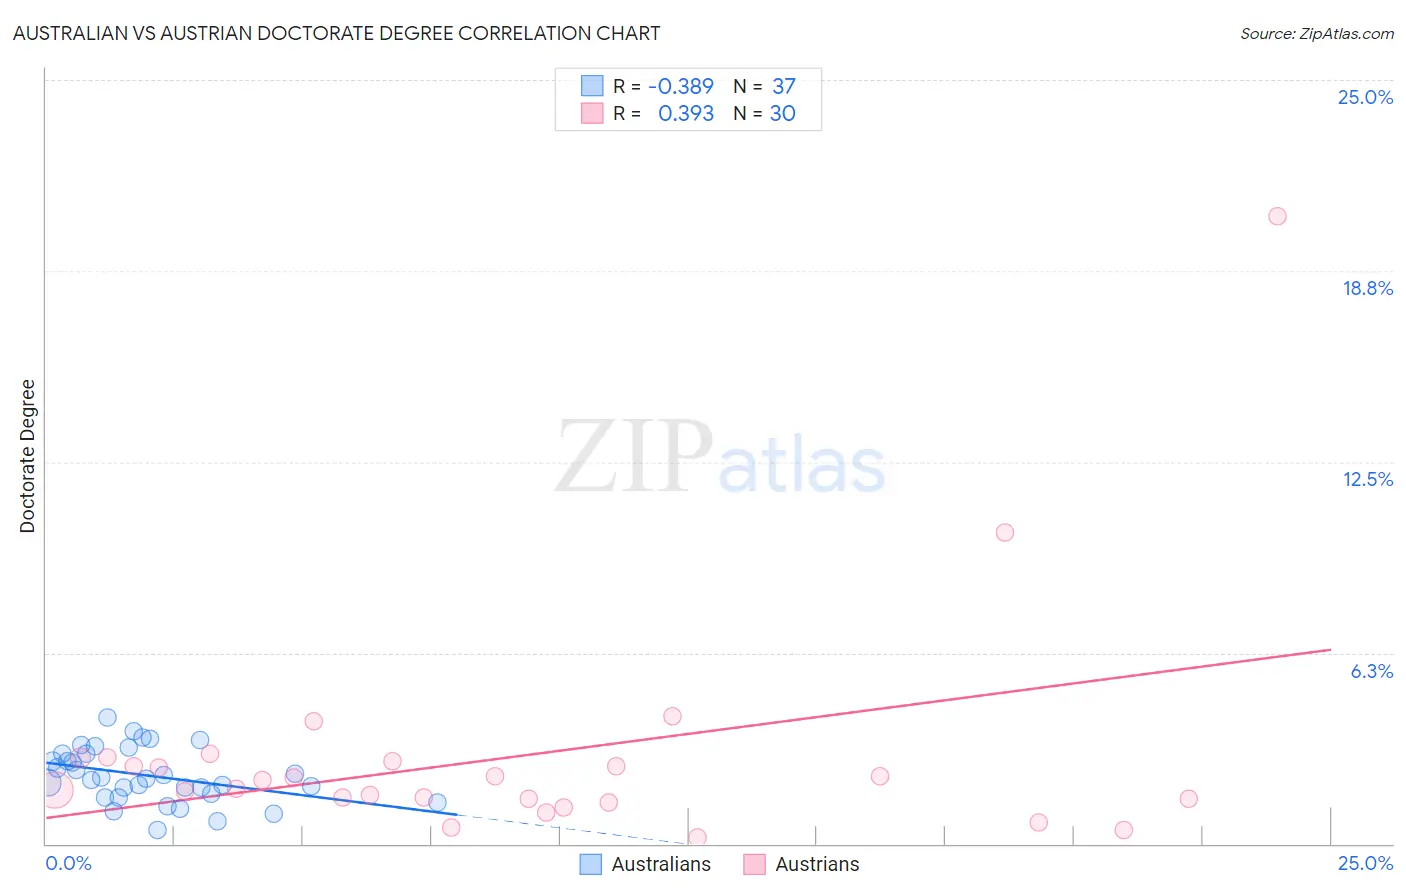
Australian vs Austrian Doctorate Degree Correlation Chart
The statistical analysis conducted on geographies consisting of 223,128,872 people shows a mild negative correlation between the proportion of Australians and percentage of population with at least doctorate degree education in the United States with a correlation coefficient (R) of -0.389 and weighted average of 2.4%. Similarly, the statistical analysis conducted on geographies consisting of 445,801,331 people shows a mild positive correlation between the proportion of Austrians and percentage of population with at least doctorate degree education in the United States with a correlation coefficient (R) of 0.393 and weighted average of 2.1%, a difference of 14.0%.
Doctorate Degree Correlation Summary
| Measurement | Australian | Austrian |
| Minimum | 0.45% | 0.20% |
| Maximum | 4.2% | 20.5% |
| Range | 3.7% | 20.3% |
| Mean | 2.2% | 2.8% |
| Median | 2.1% | 1.9% |
| Interquartile 25% (IQ1) | 1.6% | 1.5% |
| Interquartile 75% (IQ3) | 3.0% | 2.7% |
| Interquartile Range (IQR) | 1.4% | 1.2% |
| Standard Deviation (Sample) | 0.88% | 3.8% |
| Standard Deviation (Population) | 0.87% | 3.7% |
Similar Demographics by Doctorate Degree
Demographics Similar to Australians by Doctorate Degree
In terms of doctorate degree, the demographic groups most similar to Australians are Immigrants from Norway (2.4%, a difference of 0.090%), Bulgarian (2.4%, a difference of 0.47%), Immigrants from Latvia (2.4%, a difference of 0.59%), Immigrants from Asia (2.4%, a difference of 1.2%), and Immigrants from Indonesia (2.4%, a difference of 1.3%).
| Demographics | Rating | Rank | Doctorate Degree |
| Immigrants | Netherlands | 100.0 /100 | #44 | Exceptional 2.5% |
| Immigrants | South Africa | 100.0 /100 | #45 | Exceptional 2.4% |
| Immigrants | Austria | 100.0 /100 | #46 | Exceptional 2.4% |
| Immigrants | Western Europe | 100.0 /100 | #47 | Exceptional 2.4% |
| Asians | 100.0 /100 | #48 | Exceptional 2.4% |
| Immigrants | Asia | 100.0 /100 | #49 | Exceptional 2.4% |
| Immigrants | Norway | 100.0 /100 | #50 | Exceptional 2.4% |
| Australians | 100.0 /100 | #51 | Exceptional 2.4% |
| Bulgarians | 100.0 /100 | #52 | Exceptional 2.4% |
| Immigrants | Latvia | 100.0 /100 | #53 | Exceptional 2.4% |
| Immigrants | Indonesia | 100.0 /100 | #54 | Exceptional 2.4% |
| Bolivians | 100.0 /100 | #55 | Exceptional 2.4% |
| Immigrants | Czechoslovakia | 100.0 /100 | #56 | Exceptional 2.4% |
| Immigrants | Ethiopia | 100.0 /100 | #57 | Exceptional 2.4% |
| Ethiopians | 99.9 /100 | #58 | Exceptional 2.3% |
Demographics Similar to Austrians by Doctorate Degree
In terms of doctorate degree, the demographic groups most similar to Austrians are Romanian (2.1%, a difference of 0.12%), Immigrants from Chile (2.1%, a difference of 0.13%), Immigrants from Eastern Africa (2.1%, a difference of 0.35%), Arab (2.1%, a difference of 0.35%), and Immigrants from Egypt (2.1%, a difference of 0.38%).
| Demographics | Rating | Rank | Doctorate Degree |
| Immigrants | Eritrea | 98.4 /100 | #97 | Exceptional 2.1% |
| Armenians | 98.3 /100 | #98 | Exceptional 2.1% |
| Immigrants | Egypt | 98.2 /100 | #99 | Exceptional 2.1% |
| Immigrants | Eastern Europe | 98.2 /100 | #100 | Exceptional 2.1% |
| Immigrants | Eastern Africa | 98.2 /100 | #101 | Exceptional 2.1% |
| Immigrants | Chile | 98.1 /100 | #102 | Exceptional 2.1% |
| Romanians | 98.1 /100 | #103 | Exceptional 2.1% |
| Austrians | 98.0 /100 | #104 | Exceptional 2.1% |
| Arabs | 97.8 /100 | #105 | Exceptional 2.1% |
| Sudanese | 97.7 /100 | #106 | Exceptional 2.1% |
| Europeans | 97.5 /100 | #107 | Exceptional 2.1% |
| Immigrants | Germany | 97.3 /100 | #108 | Exceptional 2.1% |
| Ukrainians | 97.2 /100 | #109 | Exceptional 2.1% |
| Brazilians | 97.2 /100 | #110 | Exceptional 2.1% |
| Immigrants | Pakistan | 97.1 /100 | #111 | Exceptional 2.1% |