Austrian vs Immigrants from Ethiopia 7th Grade
COMPARE
Austrian
Immigrants from Ethiopia
7th Grade
7th Grade Comparison
Austrians
Immigrants from Ethiopia
97.0%
7TH GRADE
99.8/ 100
METRIC RATING
53rd/ 347
METRIC RANK
95.3%
7TH GRADE
0.9/ 100
METRIC RATING
252nd/ 347
METRIC RANK
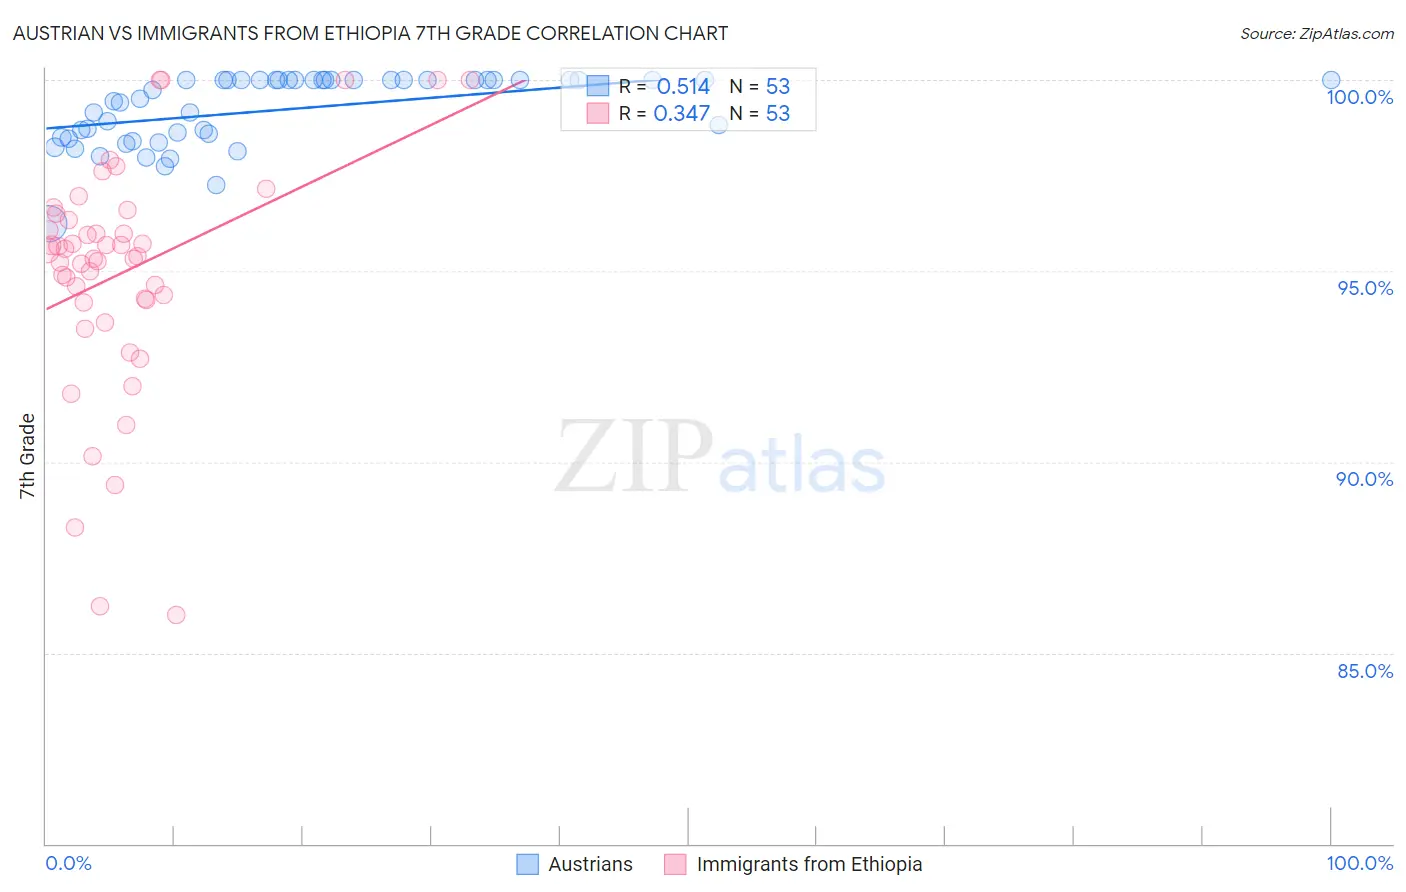
Austrian vs Immigrants from Ethiopia 7th Grade Correlation Chart
The statistical analysis conducted on geographies consisting of 452,080,344 people shows a substantial positive correlation between the proportion of Austrians and percentage of population with at least 7th grade education in the United States with a correlation coefficient (R) of 0.514 and weighted average of 97.0%. Similarly, the statistical analysis conducted on geographies consisting of 211,528,629 people shows a mild positive correlation between the proportion of Immigrants from Ethiopia and percentage of population with at least 7th grade education in the United States with a correlation coefficient (R) of 0.347 and weighted average of 95.3%, a difference of 1.7%.
7th Grade Correlation Summary
| Measurement | Austrian | Immigrants from Ethiopia |
| Minimum | 96.3% | 86.0% |
| Maximum | 100.0% | 100.0% |
| Range | 3.7% | 14.0% |
| Mean | 99.2% | 95.0% |
| Median | 99.7% | 95.4% |
| Interquartile 25% (IQ1) | 98.5% | 94.2% |
| Interquartile 75% (IQ3) | 100.0% | 96.4% |
| Interquartile Range (IQR) | 1.5% | 2.2% |
| Standard Deviation (Sample) | 0.92% | 3.0% |
| Standard Deviation (Population) | 0.91% | 3.0% |
Similar Demographics by 7th Grade
Demographics Similar to Austrians by 7th Grade
In terms of 7th grade, the demographic groups most similar to Austrians are Greek (97.0%, a difference of 0.010%), Australian (97.0%, a difference of 0.010%), Estonian (97.0%, a difference of 0.030%), Russian (97.0%, a difference of 0.030%), and Serbian (97.0%, a difference of 0.030%).
| Demographics | Rating | Rank | 7th Grade |
| Aleuts | 99.9 /100 | #46 | Exceptional 97.1% |
| Bulgarians | 99.9 /100 | #47 | Exceptional 97.1% |
| Celtics | 99.9 /100 | #48 | Exceptional 97.1% |
| Slavs | 99.9 /100 | #49 | Exceptional 97.1% |
| Immigrants | Scotland | 99.9 /100 | #50 | Exceptional 97.1% |
| Estonians | 99.9 /100 | #51 | Exceptional 97.0% |
| Greeks | 99.9 /100 | #52 | Exceptional 97.0% |
| Austrians | 99.8 /100 | #53 | Exceptional 97.0% |
| Australians | 99.8 /100 | #54 | Exceptional 97.0% |
| Russians | 99.8 /100 | #55 | Exceptional 97.0% |
| Serbians | 99.8 /100 | #56 | Exceptional 97.0% |
| Americans | 99.8 /100 | #57 | Exceptional 97.0% |
| Whites/Caucasians | 99.8 /100 | #58 | Exceptional 97.0% |
| Macedonians | 99.8 /100 | #59 | Exceptional 97.0% |
| Immigrants | Canada | 99.8 /100 | #60 | Exceptional 96.9% |
Demographics Similar to Immigrants from Ethiopia by 7th Grade
In terms of 7th grade, the demographic groups most similar to Immigrants from Ethiopia are Immigrants from Cameroon (95.4%, a difference of 0.0%), Immigrants from Jamaica (95.4%, a difference of 0.0%), Somali (95.3%, a difference of 0.010%), Colombian (95.3%, a difference of 0.020%), and Paiute (95.4%, a difference of 0.030%).
| Demographics | Rating | Rank | 7th Grade |
| Immigrants | Middle Africa | 1.5 /100 | #245 | Tragic 95.4% |
| Ethiopians | 1.5 /100 | #246 | Tragic 95.4% |
| Tongans | 1.3 /100 | #247 | Tragic 95.4% |
| Paiute | 1.2 /100 | #248 | Tragic 95.4% |
| Bolivians | 1.1 /100 | #249 | Tragic 95.4% |
| Immigrants | Cameroon | 0.9 /100 | #250 | Tragic 95.4% |
| Immigrants | Jamaica | 0.9 /100 | #251 | Tragic 95.4% |
| Immigrants | Ethiopia | 0.9 /100 | #252 | Tragic 95.3% |
| Somalis | 0.9 /100 | #253 | Tragic 95.3% |
| Colombians | 0.8 /100 | #254 | Tragic 95.3% |
| Koreans | 0.8 /100 | #255 | Tragic 95.3% |
| Immigrants | China | 0.7 /100 | #256 | Tragic 95.3% |
| Immigrants | Congo | 0.7 /100 | #257 | Tragic 95.3% |
| Ghanaians | 0.7 /100 | #258 | Tragic 95.3% |
| Immigrants | Costa Rica | 0.6 /100 | #259 | Tragic 95.3% |