Austrian vs Scandinavian Bachelor's Degree
COMPARE
Austrian
Scandinavian
Bachelor's Degree
Bachelor's Degree Comparison
Austrians
Scandinavians
40.6%
BACHELOR'S DEGREE
95.5/ 100
METRIC RATING
117th/ 347
METRIC RANK
37.5%
BACHELOR'S DEGREE
41.7/ 100
METRIC RATING
184th/ 347
METRIC RANK
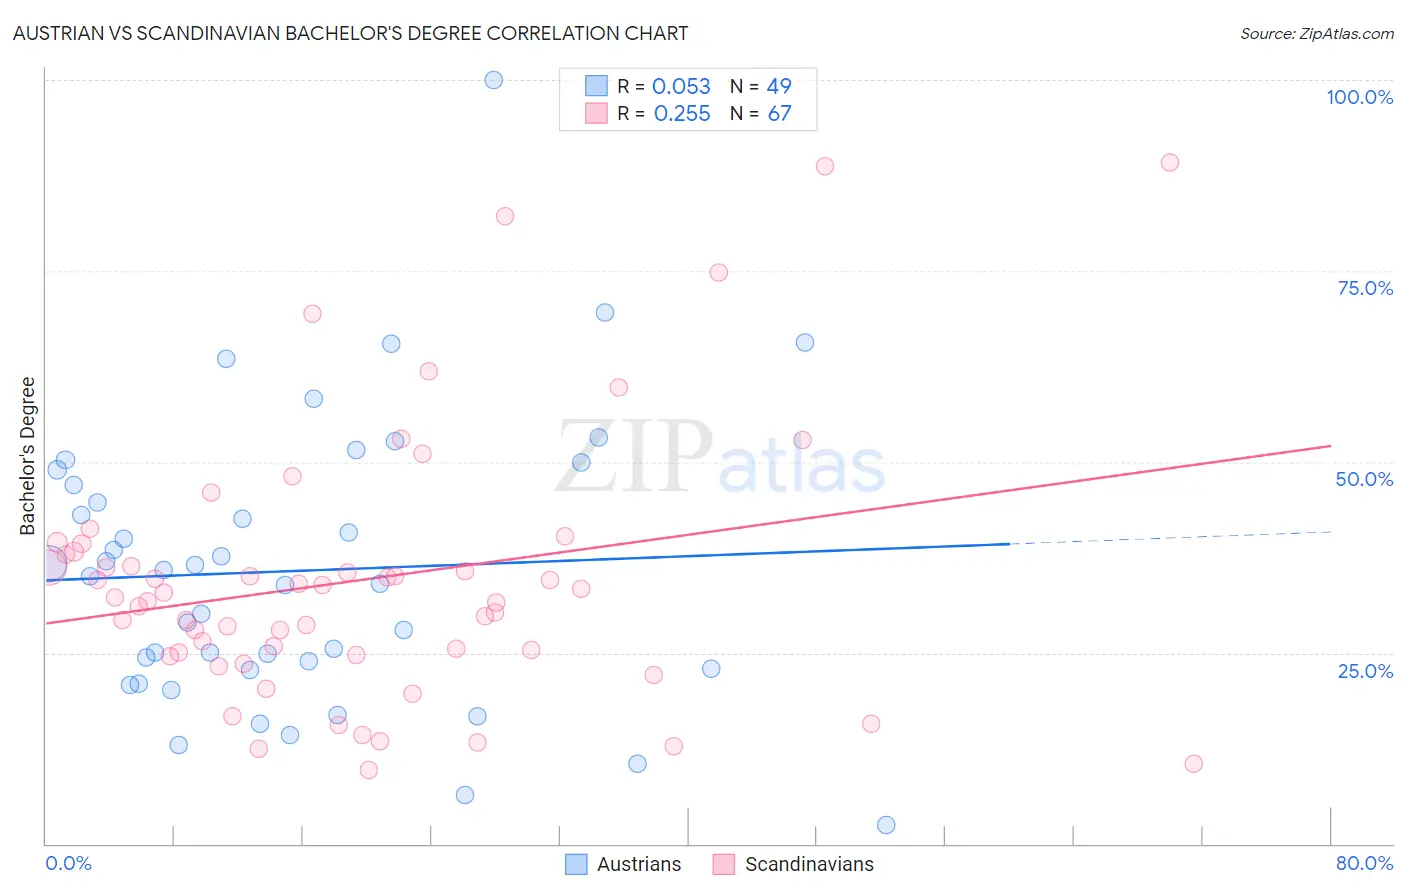
Austrian vs Scandinavian Bachelor's Degree Correlation Chart
The statistical analysis conducted on geographies consisting of 452,047,267 people shows a slight positive correlation between the proportion of Austrians and percentage of population with at least bachelor's degree education in the United States with a correlation coefficient (R) of 0.053 and weighted average of 40.6%. Similarly, the statistical analysis conducted on geographies consisting of 472,607,707 people shows a weak positive correlation between the proportion of Scandinavians and percentage of population with at least bachelor's degree education in the United States with a correlation coefficient (R) of 0.255 and weighted average of 37.5%, a difference of 8.3%.
Bachelor's Degree Correlation Summary
| Measurement | Austrian | Scandinavian |
| Minimum | 2.4% | 9.7% |
| Maximum | 100.0% | 89.2% |
| Range | 97.6% | 79.4% |
| Mean | 35.7% | 34.6% |
| Median | 35.1% | 32.2% |
| Interquartile 25% (IQ1) | 22.9% | 24.7% |
| Interquartile 75% (IQ3) | 48.0% | 38.3% |
| Interquartile Range (IQR) | 25.1% | 13.5% |
| Standard Deviation (Sample) | 18.7% | 17.4% |
| Standard Deviation (Population) | 18.5% | 17.3% |
Similar Demographics by Bachelor's Degree
Demographics Similar to Austrians by Bachelor's Degree
In terms of bachelor's degree, the demographic groups most similar to Austrians are Croatian (40.6%, a difference of 0.020%), Immigrants from Uganda (40.7%, a difference of 0.10%), Palestinian (40.7%, a difference of 0.15%), Immigrants from Syria (40.5%, a difference of 0.34%), and Afghan (40.8%, a difference of 0.39%).
| Demographics | Rating | Rank | Bachelor's Degree |
| Albanians | 96.5 /100 | #110 | Exceptional 40.9% |
| Immigrants | Chile | 96.4 /100 | #111 | Exceptional 40.8% |
| Ugandans | 96.3 /100 | #112 | Exceptional 40.8% |
| Brazilians | 96.3 /100 | #113 | Exceptional 40.8% |
| Afghans | 96.2 /100 | #114 | Exceptional 40.8% |
| Palestinians | 95.8 /100 | #115 | Exceptional 40.7% |
| Immigrants | Uganda | 95.7 /100 | #116 | Exceptional 40.7% |
| Austrians | 95.5 /100 | #117 | Exceptional 40.6% |
| Croatians | 95.5 /100 | #118 | Exceptional 40.6% |
| Immigrants | Syria | 94.9 /100 | #119 | Exceptional 40.5% |
| Venezuelans | 94.7 /100 | #120 | Exceptional 40.5% |
| Moroccans | 94.6 /100 | #121 | Exceptional 40.5% |
| Immigrants | Albania | 94.4 /100 | #122 | Exceptional 40.4% |
| Lebanese | 94.3 /100 | #123 | Exceptional 40.4% |
| Immigrants | Eritrea | 94.3 /100 | #124 | Exceptional 40.4% |
Demographics Similar to Scandinavians by Bachelor's Degree
In terms of bachelor's degree, the demographic groups most similar to Scandinavians are Senegalese (37.5%, a difference of 0.040%), Immigrants from Peru (37.5%, a difference of 0.040%), Norwegian (37.5%, a difference of 0.14%), Immigrants from Bosnia and Herzegovina (37.6%, a difference of 0.17%), and Immigrants from Senegal (37.6%, a difference of 0.20%).
| Demographics | Rating | Rank | Bachelor's Degree |
| Basques | 47.4 /100 | #177 | Average 37.7% |
| Immigrants | Cameroon | 46.8 /100 | #178 | Average 37.7% |
| Immigrants | Colombia | 45.4 /100 | #179 | Average 37.7% |
| Irish | 44.3 /100 | #180 | Average 37.6% |
| Immigrants | Senegal | 43.8 /100 | #181 | Average 37.6% |
| Immigrants | Bosnia and Herzegovina | 43.4 /100 | #182 | Average 37.6% |
| Senegalese | 42.2 /100 | #183 | Average 37.5% |
| Scandinavians | 41.7 /100 | #184 | Average 37.5% |
| Immigrants | Peru | 41.3 /100 | #185 | Average 37.5% |
| Norwegians | 40.4 /100 | #186 | Average 37.5% |
| English | 39.7 /100 | #187 | Fair 37.4% |
| Immigrants | Oceania | 37.3 /100 | #188 | Fair 37.3% |
| Slovaks | 36.9 /100 | #189 | Fair 37.3% |
| Swiss | 34.1 /100 | #190 | Fair 37.2% |
| Nigerians | 33.9 /100 | #191 | Fair 37.2% |