Bangladeshi vs Ute Doctorate Degree
COMPARE
Bangladeshi
Ute
Doctorate Degree
Doctorate Degree Comparison
Bangladeshis
Ute
1.2%
DOCTORATE DEGREE
0.0/ 100
METRIC RATING
337th/ 347
METRIC RANK
2.0%
DOCTORATE DEGREE
93.2/ 100
METRIC RATING
124th/ 347
METRIC RANK
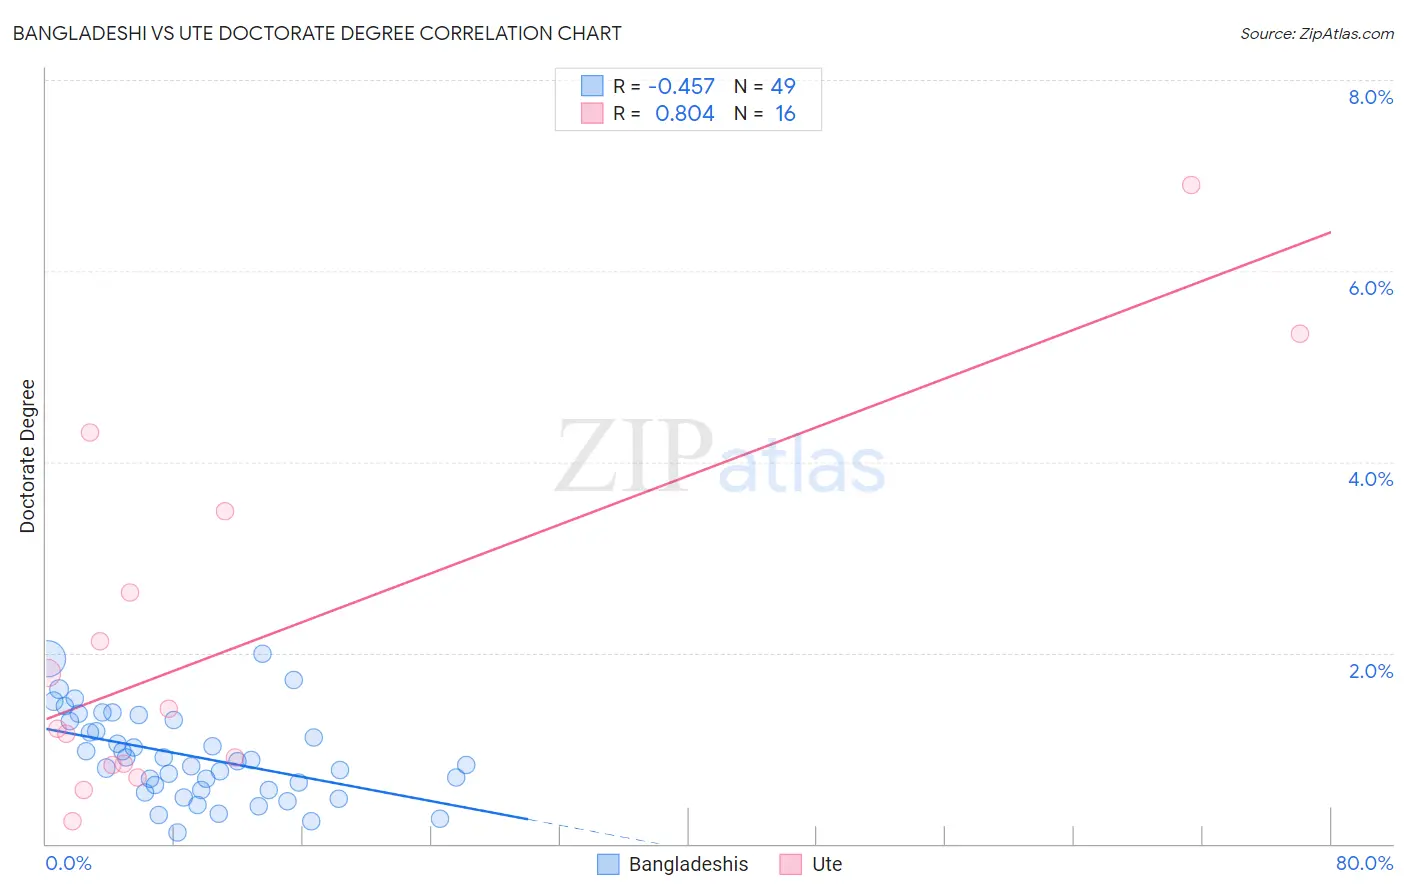
Bangladeshi vs Ute Doctorate Degree Correlation Chart
The statistical analysis conducted on geographies consisting of 140,269,397 people shows a moderate negative correlation between the proportion of Bangladeshis and percentage of population with at least doctorate degree education in the United States with a correlation coefficient (R) of -0.457 and weighted average of 1.2%. Similarly, the statistical analysis conducted on geographies consisting of 55,479,547 people shows a very strong positive correlation between the proportion of Ute and percentage of population with at least doctorate degree education in the United States with a correlation coefficient (R) of 0.804 and weighted average of 2.0%, a difference of 66.4%.
Doctorate Degree Correlation Summary
| Measurement | Bangladeshi | Ute |
| Minimum | 0.12% | 0.23% |
| Maximum | 2.0% | 6.9% |
| Range | 1.9% | 6.7% |
| Mean | 0.92% | 2.1% |
| Median | 0.87% | 1.3% |
| Interquartile 25% (IQ1) | 0.56% | 0.83% |
| Interquartile 75% (IQ3) | 1.3% | 3.1% |
| Interquartile Range (IQR) | 0.72% | 2.2% |
| Standard Deviation (Sample) | 0.45% | 1.9% |
| Standard Deviation (Population) | 0.45% | 1.9% |
Similar Demographics by Doctorate Degree
Demographics Similar to Bangladeshis by Doctorate Degree
In terms of doctorate degree, the demographic groups most similar to Bangladeshis are Puget Sound Salish (1.2%, a difference of 0.75%), Immigrants from Central America (1.2%, a difference of 2.1%), Immigrants from Cuba (1.2%, a difference of 2.9%), Mexican (1.2%, a difference of 3.4%), and Nepalese (1.3%, a difference of 3.5%).
| Demographics | Rating | Rank | Doctorate Degree |
| Yup'ik | 0.0 /100 | #330 | Tragic 1.3% |
| Immigrants | Latin America | 0.0 /100 | #331 | Tragic 1.3% |
| Yakama | 0.0 /100 | #332 | Tragic 1.3% |
| Immigrants | Caribbean | 0.0 /100 | #333 | Tragic 1.3% |
| Immigrants | Dominican Republic | 0.0 /100 | #334 | Tragic 1.3% |
| Immigrants | Haiti | 0.0 /100 | #335 | Tragic 1.3% |
| Nepalese | 0.0 /100 | #336 | Tragic 1.3% |
| Bangladeshis | 0.0 /100 | #337 | Tragic 1.2% |
| Puget Sound Salish | 0.0 /100 | #338 | Tragic 1.2% |
| Immigrants | Central America | 0.0 /100 | #339 | Tragic 1.2% |
| Immigrants | Cuba | 0.0 /100 | #340 | Tragic 1.2% |
| Mexicans | 0.0 /100 | #341 | Tragic 1.2% |
| Arapaho | 0.0 /100 | #342 | Tragic 1.2% |
| Fijians | 0.0 /100 | #343 | Tragic 1.1% |
| Immigrants | Mexico | 0.0 /100 | #344 | Tragic 1.1% |
Demographics Similar to Ute by Doctorate Degree
In terms of doctorate degree, the demographic groups most similar to Ute are Moroccan (2.0%, a difference of 0.11%), Croatian (2.0%, a difference of 0.47%), Jordanian (2.0%, a difference of 0.52%), Palestinian (2.0%, a difference of 0.56%), and Immigrants from Southern Europe (2.0%, a difference of 0.93%).
| Demographics | Rating | Rank | Doctorate Degree |
| Lebanese | 96.0 /100 | #117 | Exceptional 2.1% |
| Icelanders | 96.0 /100 | #118 | Exceptional 2.1% |
| Pakistanis | 95.8 /100 | #119 | Exceptional 2.0% |
| Immigrants | Morocco | 95.5 /100 | #120 | Exceptional 2.0% |
| Immigrants | Jordan | 94.8 /100 | #121 | Exceptional 2.0% |
| Immigrants | Southern Europe | 94.7 /100 | #122 | Exceptional 2.0% |
| Croatians | 94.0 /100 | #123 | Exceptional 2.0% |
| Ute | 93.2 /100 | #124 | Exceptional 2.0% |
| Moroccans | 93.0 /100 | #125 | Exceptional 2.0% |
| Jordanians | 92.1 /100 | #126 | Exceptional 2.0% |
| Palestinians | 92.0 /100 | #127 | Exceptional 2.0% |
| Immigrants | Zaire | 91.1 /100 | #128 | Exceptional 2.0% |
| Canadians | 90.6 /100 | #129 | Exceptional 2.0% |
| Immigrants | Ukraine | 90.5 /100 | #130 | Exceptional 2.0% |
| Immigrants | Sierra Leone | 90.2 /100 | #131 | Exceptional 2.0% |