Blackfeet vs French 7th Grade
COMPARE
Blackfeet
French
7th Grade
7th Grade Comparison
Blackfeet
French
96.3%
7TH GRADE
83.9/ 100
METRIC RATING
145th/ 347
METRIC RANK
97.4%
7TH GRADE
100.0/ 100
METRIC RATING
25th/ 347
METRIC RANK
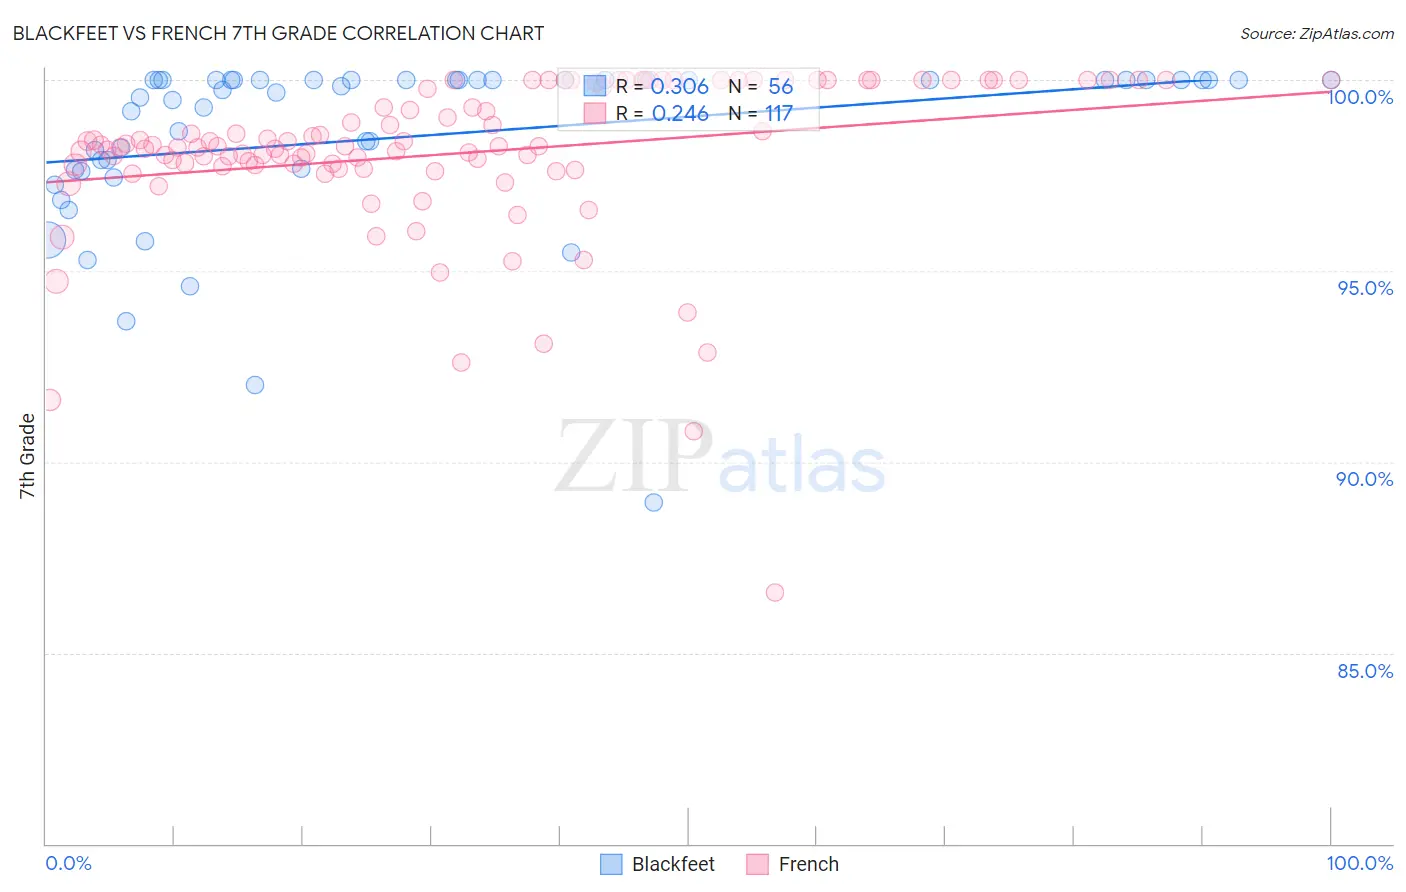
Blackfeet vs French 7th Grade Correlation Chart
The statistical analysis conducted on geographies consisting of 309,580,957 people shows a mild positive correlation between the proportion of Blackfeet and percentage of population with at least 7th grade education in the United States with a correlation coefficient (R) of 0.306 and weighted average of 96.3%. Similarly, the statistical analysis conducted on geographies consisting of 572,427,255 people shows a weak positive correlation between the proportion of French and percentage of population with at least 7th grade education in the United States with a correlation coefficient (R) of 0.246 and weighted average of 97.4%, a difference of 1.2%.
7th Grade Correlation Summary
| Measurement | Blackfeet | French |
| Minimum | 88.9% | 86.6% |
| Maximum | 100.0% | 100.0% |
| Range | 11.1% | 13.4% |
| Mean | 98.5% | 98.1% |
| Median | 99.8% | 98.3% |
| Interquartile 25% (IQ1) | 97.7% | 97.8% |
| Interquartile 75% (IQ3) | 100.0% | 100.0% |
| Interquartile Range (IQR) | 2.3% | 2.2% |
| Standard Deviation (Sample) | 2.3% | 2.1% |
| Standard Deviation (Population) | 2.3% | 2.1% |
Similar Demographics by 7th Grade
Demographics Similar to Blackfeet by 7th Grade
In terms of 7th grade, the demographic groups most similar to Blackfeet are Immigrants from Eastern Europe (96.3%, a difference of 0.0%), French American Indian (96.3%, a difference of 0.010%), Israeli (96.3%, a difference of 0.010%), Albanian (96.3%, a difference of 0.010%), and Immigrants from Greece (96.3%, a difference of 0.020%).
| Demographics | Rating | Rank | 7th Grade |
| Jordanians | 90.0 /100 | #138 | Excellent 96.4% |
| Basques | 89.3 /100 | #139 | Excellent 96.4% |
| Cambodians | 88.3 /100 | #140 | Excellent 96.3% |
| Immigrants | South Central Asia | 87.1 /100 | #141 | Excellent 96.3% |
| Burmese | 87.1 /100 | #142 | Excellent 96.3% |
| Spanish | 86.6 /100 | #143 | Excellent 96.3% |
| Immigrants | Greece | 85.9 /100 | #144 | Excellent 96.3% |
| Blackfeet | 83.9 /100 | #145 | Excellent 96.3% |
| Immigrants | Eastern Europe | 83.7 /100 | #146 | Excellent 96.3% |
| French American Indians | 83.1 /100 | #147 | Excellent 96.3% |
| Israelis | 82.8 /100 | #148 | Excellent 96.3% |
| Albanians | 82.6 /100 | #149 | Excellent 96.3% |
| Immigrants | Belarus | 82.4 /100 | #150 | Excellent 96.3% |
| Hopi | 81.6 /100 | #151 | Excellent 96.3% |
| Immigrants | Russia | 78.4 /100 | #152 | Good 96.2% |
Demographics Similar to French by 7th Grade
In terms of 7th grade, the demographic groups most similar to French are Welsh (97.4%, a difference of 0.0%), Scotch-Irish (97.4%, a difference of 0.010%), Danish (97.4%, a difference of 0.010%), Croatian (97.4%, a difference of 0.020%), and French Canadian (97.4%, a difference of 0.030%).
| Demographics | Rating | Rank | 7th Grade |
| Tlingit-Haida | 100.0 /100 | #18 | Exceptional 97.5% |
| Lithuanians | 100.0 /100 | #19 | Exceptional 97.5% |
| Yup'ik | 100.0 /100 | #20 | Exceptional 97.4% |
| Inupiat | 100.0 /100 | #21 | Exceptional 97.4% |
| French Canadians | 100.0 /100 | #22 | Exceptional 97.4% |
| Croatians | 100.0 /100 | #23 | Exceptional 97.4% |
| Welsh | 100.0 /100 | #24 | Exceptional 97.4% |
| French | 100.0 /100 | #25 | Exceptional 97.4% |
| Scotch-Irish | 100.0 /100 | #26 | Exceptional 97.4% |
| Danes | 100.0 /100 | #27 | Exceptional 97.4% |
| Sioux | 100.0 /100 | #28 | Exceptional 97.4% |
| Scandinavians | 100.0 /100 | #29 | Exceptional 97.4% |
| Czechs | 100.0 /100 | #30 | Exceptional 97.4% |
| Europeans | 100.0 /100 | #31 | Exceptional 97.3% |
| Italians | 100.0 /100 | #32 | Exceptional 97.3% |