British West Indian vs Crow 4th Grade
COMPARE
British West Indian
Crow
4th Grade
4th Grade Comparison
British West Indians
Crow
96.7%
4TH GRADE
0.0/ 100
METRIC RATING
290th/ 347
METRIC RANK
99.6%
4TH GRADE
100.0/ 100
METRIC RATING
1st/ 347
METRIC RANK
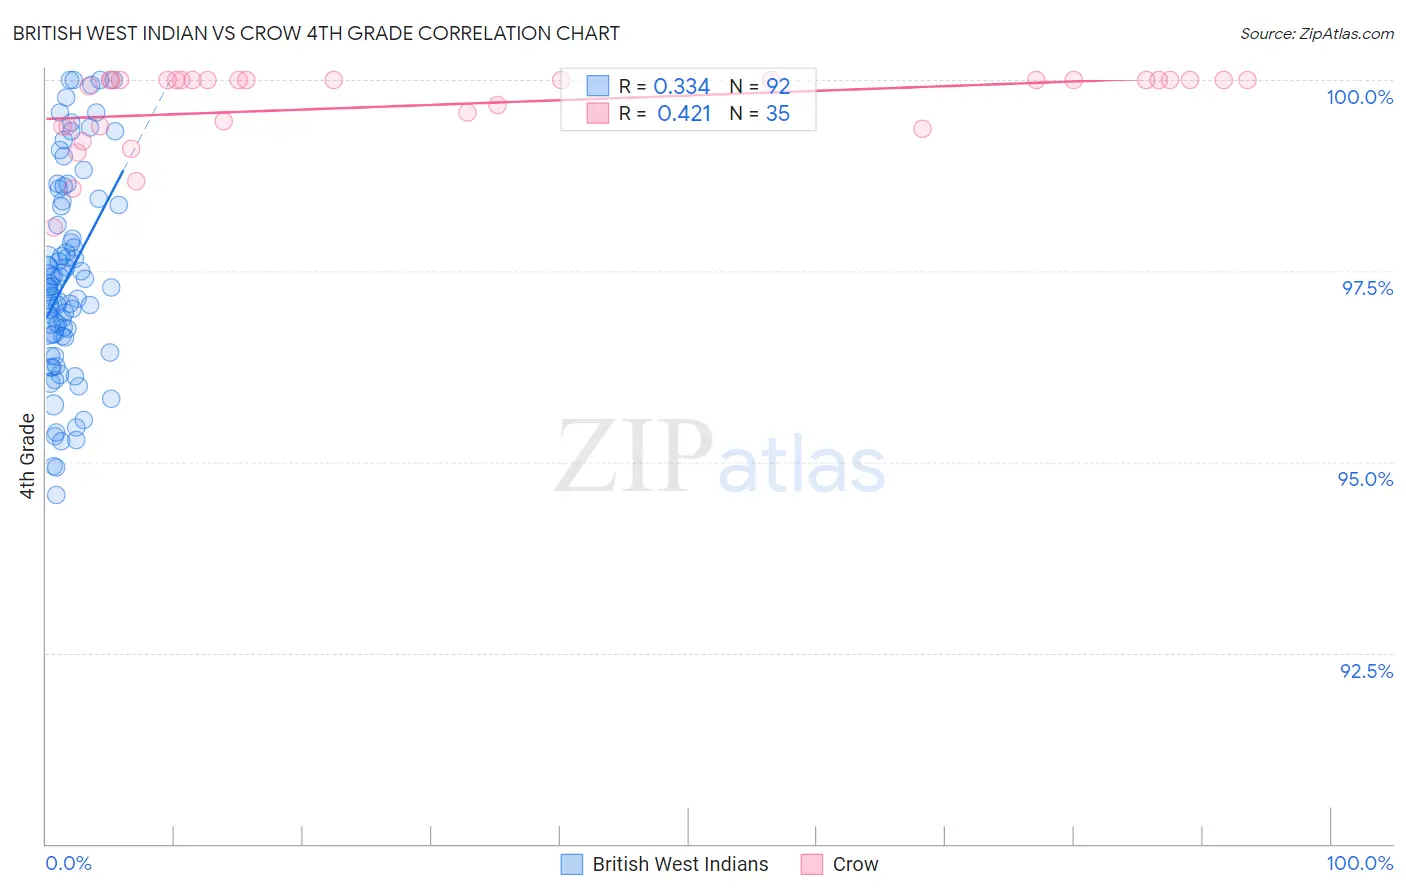
British West Indian vs Crow 4th Grade Correlation Chart
The statistical analysis conducted on geographies consisting of 152,691,173 people shows a mild positive correlation between the proportion of British West Indians and percentage of population with at least 4th grade education in the United States with a correlation coefficient (R) of 0.334 and weighted average of 96.7%. Similarly, the statistical analysis conducted on geographies consisting of 665,246 people shows a moderate positive correlation between the proportion of Crow and percentage of population with at least 4th grade education in the United States with a correlation coefficient (R) of 0.421 and weighted average of 99.6%, a difference of 2.9%.
4th Grade Correlation Summary
| Measurement | British West Indian | Crow |
| Minimum | 94.6% | 98.1% |
| Maximum | 100.0% | 100.0% |
| Range | 5.4% | 1.9% |
| Mean | 97.4% | 99.7% |
| Median | 97.3% | 100.0% |
| Interquartile 25% (IQ1) | 96.6% | 99.4% |
| Interquartile 75% (IQ3) | 98.4% | 100.0% |
| Interquartile Range (IQR) | 1.7% | 0.60% |
| Standard Deviation (Sample) | 1.3% | 0.50% |
| Standard Deviation (Population) | 1.3% | 0.49% |
Similar Demographics by 4th Grade
Demographics Similar to British West Indians by 4th Grade
In terms of 4th grade, the demographic groups most similar to British West Indians are Immigrants from West Indies (96.7%, a difference of 0.010%), Houma (96.8%, a difference of 0.030%), Immigrants from Afghanistan (96.8%, a difference of 0.030%), Immigrants from Grenada (96.7%, a difference of 0.030%), and Malaysian (96.7%, a difference of 0.040%).
| Demographics | Rating | Rank | 4th Grade |
| Immigrants | Philippines | 0.1 /100 | #283 | Tragic 96.8% |
| Immigrants | St. Vincent and the Grenadines | 0.1 /100 | #284 | Tragic 96.8% |
| Immigrants | Barbados | 0.0 /100 | #285 | Tragic 96.8% |
| Immigrants | Thailand | 0.0 /100 | #286 | Tragic 96.8% |
| Houma | 0.0 /100 | #287 | Tragic 96.8% |
| Immigrants | Afghanistan | 0.0 /100 | #288 | Tragic 96.8% |
| Immigrants | West Indies | 0.0 /100 | #289 | Tragic 96.7% |
| British West Indians | 0.0 /100 | #290 | Tragic 96.7% |
| Immigrants | Grenada | 0.0 /100 | #291 | Tragic 96.7% |
| Malaysians | 0.0 /100 | #292 | Tragic 96.7% |
| Puerto Ricans | 0.0 /100 | #293 | Tragic 96.7% |
| Immigrants | Eritrea | 0.0 /100 | #294 | Tragic 96.7% |
| Immigrants | Portugal | 0.0 /100 | #295 | Tragic 96.6% |
| Somalis | 0.0 /100 | #296 | Tragic 96.6% |
| Immigrants | Somalia | 0.0 /100 | #297 | Tragic 96.5% |
Demographics Similar to Crow by 4th Grade
In terms of 4th grade, the demographic groups most similar to Crow are Welsh (98.7%, a difference of 0.88%), Tsimshian (98.6%, a difference of 0.94%), Inupiat (98.6%, a difference of 1.0%), Yup'ik (98.5%, a difference of 1.0%), and Norwegian (98.5%, a difference of 1.1%).
| Demographics | Rating | Rank | 4th Grade |
| Crow | 100.0 /100 | #1 | Exceptional 99.6% |
| Welsh | 100.0 /100 | #2 | Exceptional 98.7% |
| Tsimshian | 100.0 /100 | #3 | Exceptional 98.6% |
| Inupiat | 100.0 /100 | #4 | Exceptional 98.6% |
| Yup'ik | 100.0 /100 | #5 | Exceptional 98.5% |
| Norwegians | 100.0 /100 | #6 | Exceptional 98.5% |
| Slovaks | 100.0 /100 | #7 | Exceptional 98.5% |
| Germans | 100.0 /100 | #8 | Exceptional 98.5% |
| Slovenes | 100.0 /100 | #9 | Exceptional 98.4% |
| Alaskan Athabascans | 100.0 /100 | #10 | Exceptional 98.4% |
| English | 100.0 /100 | #11 | Exceptional 98.4% |
| Tlingit-Haida | 100.0 /100 | #12 | Exceptional 98.4% |
| Swedes | 100.0 /100 | #13 | Exceptional 98.4% |
| Carpatho Rusyns | 100.0 /100 | #14 | Exceptional 98.4% |
| Dutch | 100.0 /100 | #15 | Exceptional 98.4% |