Cambodian vs Cheyenne Associate's Degree
COMPARE
Cambodian
Cheyenne
Associate's Degree
Associate's Degree Comparison
Cambodians
Cheyenne
54.6%
ASSOCIATE'S DEGREE
100.0/ 100
METRIC RATING
20th/ 347
METRIC RANK
38.7%
ASSOCIATE'S DEGREE
0.0/ 100
METRIC RATING
298th/ 347
METRIC RANK
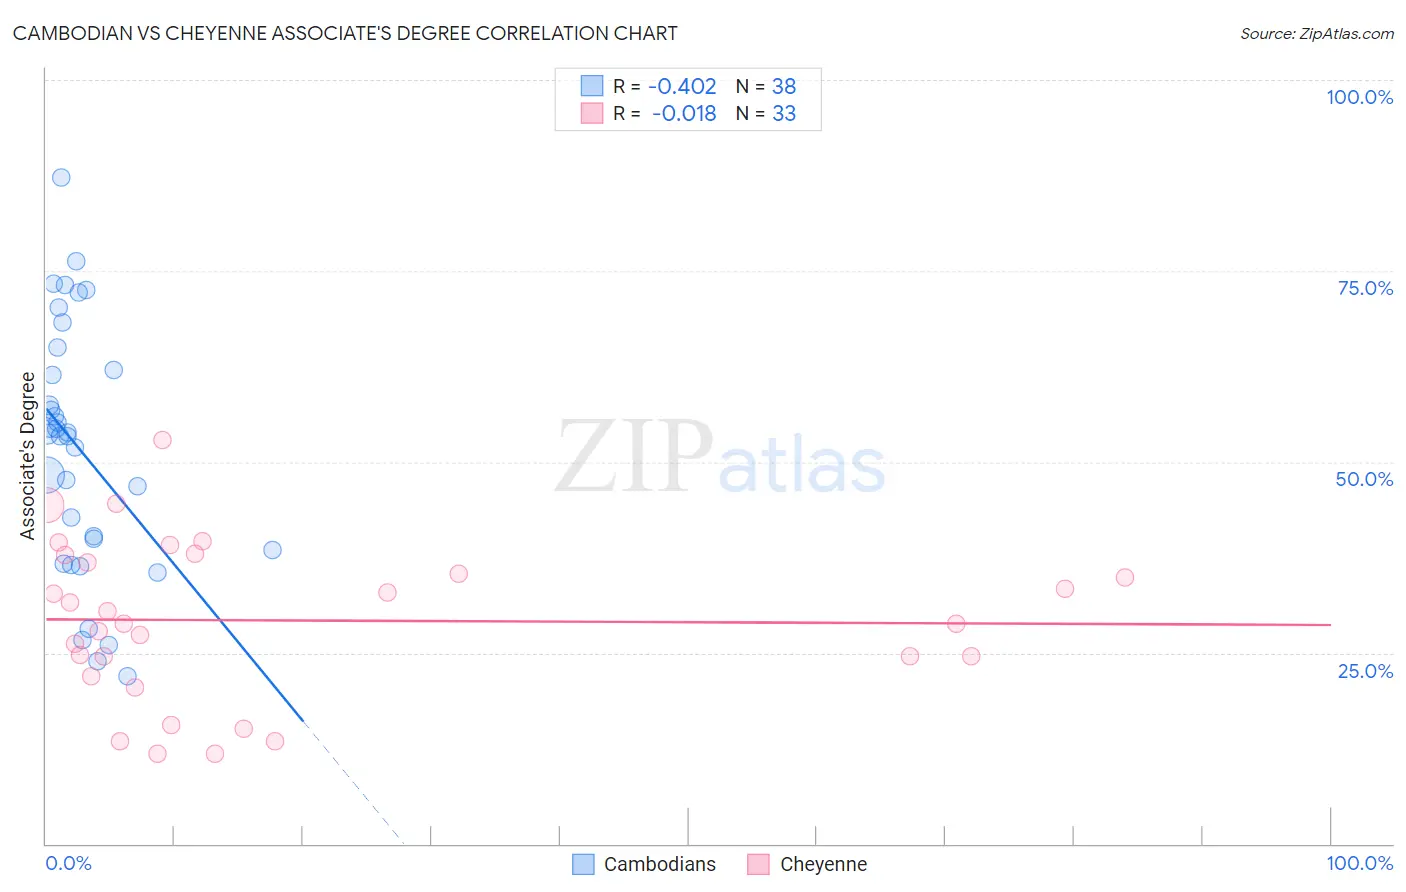
Cambodian vs Cheyenne Associate's Degree Correlation Chart
The statistical analysis conducted on geographies consisting of 102,512,775 people shows a moderate negative correlation between the proportion of Cambodians and percentage of population with at least associate's degree education in the United States with a correlation coefficient (R) of -0.402 and weighted average of 54.6%. Similarly, the statistical analysis conducted on geographies consisting of 80,719,085 people shows no correlation between the proportion of Cheyenne and percentage of population with at least associate's degree education in the United States with a correlation coefficient (R) of -0.018 and weighted average of 38.7%, a difference of 41.3%.
Associate's Degree Correlation Summary
| Measurement | Cambodian | Cheyenne |
| Minimum | 21.9% | 11.8% |
| Maximum | 87.2% | 52.8% |
| Range | 65.4% | 41.1% |
| Mean | 51.5% | 29.2% |
| Median | 53.5% | 28.8% |
| Interquartile 25% (IQ1) | 38.4% | 23.2% |
| Interquartile 75% (IQ3) | 62.1% | 37.3% |
| Interquartile Range (IQR) | 23.7% | 14.1% |
| Standard Deviation (Sample) | 16.3% | 10.3% |
| Standard Deviation (Population) | 16.1% | 10.1% |
Similar Demographics by Associate's Degree
Demographics Similar to Cambodians by Associate's Degree
In terms of associate's degree, the demographic groups most similar to Cambodians are Immigrants from Ireland (54.7%, a difference of 0.020%), Immigrants from Sweden (54.6%, a difference of 0.060%), Immigrants from Japan (54.6%, a difference of 0.10%), Burmese (54.6%, a difference of 0.10%), and Immigrants from Korea (54.5%, a difference of 0.19%).
| Demographics | Rating | Rank | Associate's Degree |
| Immigrants | China | 100.0 /100 | #13 | Exceptional 55.5% |
| Immigrants | Hong Kong | 100.0 /100 | #14 | Exceptional 55.4% |
| Immigrants | Eastern Asia | 100.0 /100 | #15 | Exceptional 55.4% |
| Soviet Union | 100.0 /100 | #16 | Exceptional 55.1% |
| Eastern Europeans | 100.0 /100 | #17 | Exceptional 55.0% |
| Indians (Asian) | 100.0 /100 | #18 | Exceptional 54.8% |
| Immigrants | Ireland | 100.0 /100 | #19 | Exceptional 54.7% |
| Cambodians | 100.0 /100 | #20 | Exceptional 54.6% |
| Immigrants | Sweden | 100.0 /100 | #21 | Exceptional 54.6% |
| Immigrants | Japan | 100.0 /100 | #22 | Exceptional 54.6% |
| Burmese | 100.0 /100 | #23 | Exceptional 54.6% |
| Immigrants | Korea | 100.0 /100 | #24 | Exceptional 54.5% |
| Immigrants | Switzerland | 100.0 /100 | #25 | Exceptional 54.5% |
| Immigrants | Belgium | 100.0 /100 | #26 | Exceptional 54.5% |
| Latvians | 100.0 /100 | #27 | Exceptional 53.9% |
Demographics Similar to Cheyenne by Associate's Degree
In terms of associate's degree, the demographic groups most similar to Cheyenne are Ute (38.6%, a difference of 0.090%), Chickasaw (38.6%, a difference of 0.13%), Tsimshian (38.6%, a difference of 0.19%), Cape Verdean (38.8%, a difference of 0.26%), and Colville (38.5%, a difference of 0.34%).
| Demographics | Rating | Rank | Associate's Degree |
| Dominicans | 0.0 /100 | #291 | Tragic 39.3% |
| Blacks/African Americans | 0.0 /100 | #292 | Tragic 39.1% |
| Nepalese | 0.0 /100 | #293 | Tragic 39.0% |
| Salvadorans | 0.0 /100 | #294 | Tragic 39.0% |
| Hondurans | 0.0 /100 | #295 | Tragic 38.9% |
| Cherokee | 0.0 /100 | #296 | Tragic 38.9% |
| Cape Verdeans | 0.0 /100 | #297 | Tragic 38.8% |
| Cheyenne | 0.0 /100 | #298 | Tragic 38.7% |
| Ute | 0.0 /100 | #299 | Tragic 38.6% |
| Chickasaw | 0.0 /100 | #300 | Tragic 38.6% |
| Tsimshian | 0.0 /100 | #301 | Tragic 38.6% |
| Colville | 0.0 /100 | #302 | Tragic 38.5% |
| Guatemalans | 0.0 /100 | #303 | Tragic 38.5% |
| Sioux | 0.0 /100 | #304 | Tragic 38.5% |
| Immigrants | Honduras | 0.0 /100 | #305 | Tragic 38.5% |