Cape Verdean vs Subsaharan African 6th Grade
COMPARE
Cape Verdean
Subsaharan African
6th Grade
6th Grade Comparison
Cape Verdeans
Sub-Saharan Africans
95.1%
6TH GRADE
0.0/ 100
METRIC RATING
324th/ 347
METRIC RANK
96.7%
6TH GRADE
3.5/ 100
METRIC RATING
231st/ 347
METRIC RANK
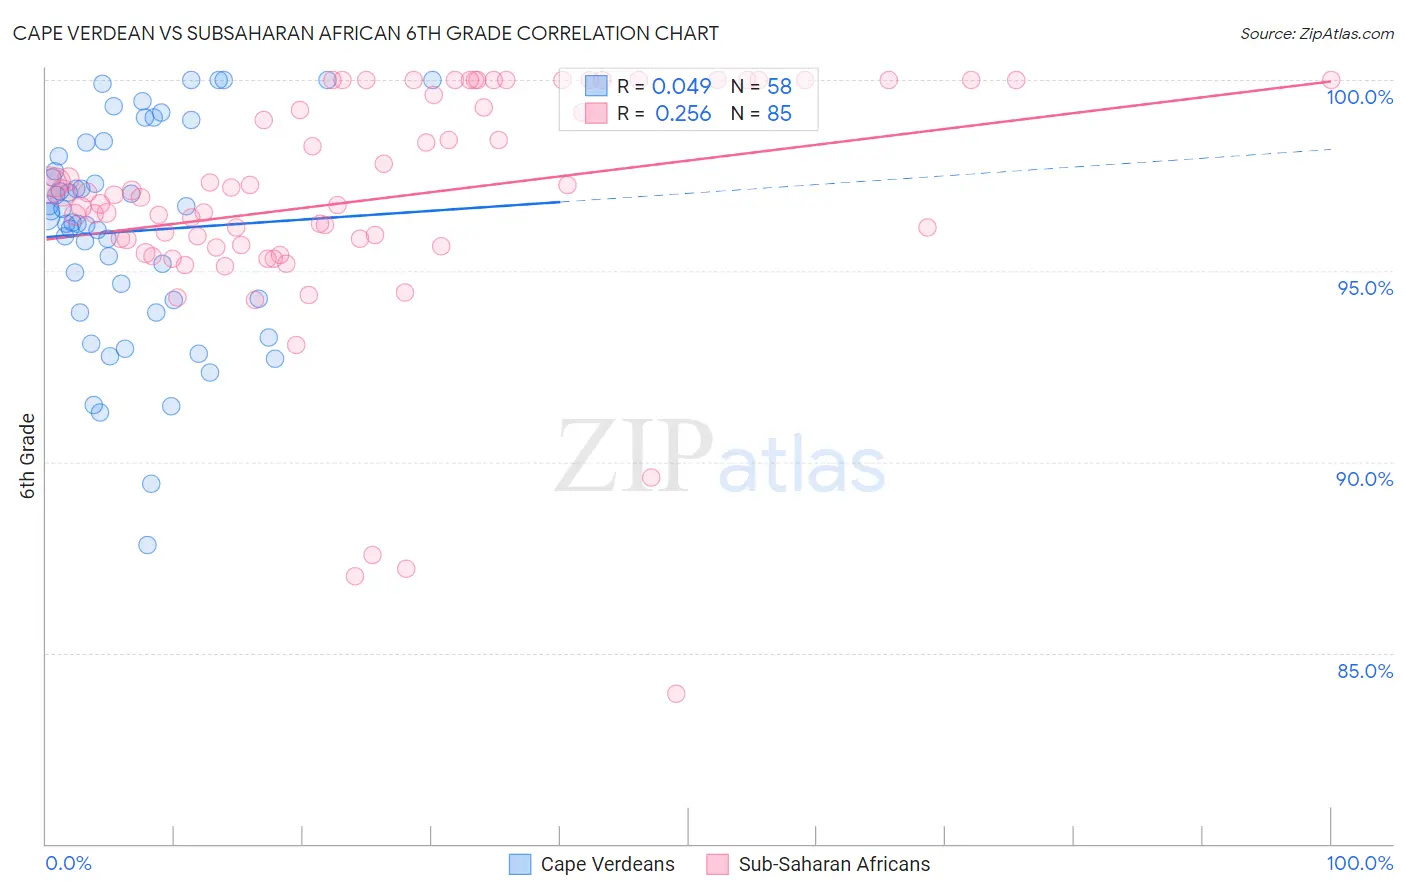
Cape Verdean vs Subsaharan African 6th Grade Correlation Chart
The statistical analysis conducted on geographies consisting of 107,537,955 people shows no correlation between the proportion of Cape Verdeans and percentage of population with at least 6th grade education in the United States with a correlation coefficient (R) of 0.049 and weighted average of 95.1%. Similarly, the statistical analysis conducted on geographies consisting of 508,219,094 people shows a weak positive correlation between the proportion of Sub-Saharan Africans and percentage of population with at least 6th grade education in the United States with a correlation coefficient (R) of 0.256 and weighted average of 96.7%, a difference of 1.6%.
6th Grade Correlation Summary
| Measurement | Cape Verdean | Subsaharan African |
| Minimum | 87.8% | 83.9% |
| Maximum | 100.0% | 100.0% |
| Range | 12.2% | 16.1% |
| Mean | 96.0% | 96.9% |
| Median | 96.4% | 97.0% |
| Interquartile 25% (IQ1) | 94.3% | 95.7% |
| Interquartile 75% (IQ3) | 98.0% | 100.0% |
| Interquartile Range (IQR) | 3.8% | 4.3% |
| Standard Deviation (Sample) | 2.8% | 3.1% |
| Standard Deviation (Population) | 2.8% | 3.1% |
Similar Demographics by 6th Grade
Demographics Similar to Cape Verdeans by 6th Grade
In terms of 6th grade, the demographic groups most similar to Cape Verdeans are Central American Indian (95.1%, a difference of 0.030%), Immigrants from Nicaragua (95.1%, a difference of 0.030%), Immigrants from Cambodia (95.2%, a difference of 0.040%), Immigrants from Fiji (95.2%, a difference of 0.090%), and Hispanic or Latino (95.0%, a difference of 0.10%).
| Demographics | Rating | Rank | 6th Grade |
| Vietnamese | 0.0 /100 | #317 | Tragic 95.3% |
| Belizeans | 0.0 /100 | #318 | Tragic 95.3% |
| Immigrants | Belize | 0.0 /100 | #319 | Tragic 95.3% |
| Immigrants | Ecuador | 0.0 /100 | #320 | Tragic 95.3% |
| Immigrants | Fiji | 0.0 /100 | #321 | Tragic 95.2% |
| Immigrants | Cambodia | 0.0 /100 | #322 | Tragic 95.2% |
| Central American Indians | 0.0 /100 | #323 | Tragic 95.1% |
| Cape Verdeans | 0.0 /100 | #324 | Tragic 95.1% |
| Immigrants | Nicaragua | 0.0 /100 | #325 | Tragic 95.1% |
| Hispanics or Latinos | 0.0 /100 | #326 | Tragic 95.0% |
| Mexican American Indians | 0.0 /100 | #327 | Tragic 95.0% |
| Hondurans | 0.0 /100 | #328 | Tragic 95.0% |
| Dominicans | 0.0 /100 | #329 | Tragic 94.9% |
| Nepalese | 0.0 /100 | #330 | Tragic 94.9% |
| Immigrants | Armenia | 0.0 /100 | #331 | Tragic 94.9% |
Demographics Similar to Sub-Saharan Africans by 6th Grade
In terms of 6th grade, the demographic groups most similar to Sub-Saharan Africans are South American Indian (96.7%, a difference of 0.0%), Immigrants from Eastern Asia (96.7%, a difference of 0.010%), Yuman (96.7%, a difference of 0.010%), Immigrants from Panama (96.7%, a difference of 0.020%), and Immigrants from Western Asia (96.7%, a difference of 0.020%).
| Demographics | Rating | Rank | 6th Grade |
| Immigrants | Southern Europe | 4.4 /100 | #224 | Tragic 96.7% |
| Immigrants | Pakistan | 4.4 /100 | #225 | Tragic 96.7% |
| Immigrants | Panama | 4.2 /100 | #226 | Tragic 96.7% |
| Immigrants | Western Asia | 4.1 /100 | #227 | Tragic 96.7% |
| Immigrants | Malaysia | 4.0 /100 | #228 | Tragic 96.7% |
| Assyrians/Chaldeans/Syriacs | 4.0 /100 | #229 | Tragic 96.7% |
| Immigrants | Eastern Asia | 4.0 /100 | #230 | Tragic 96.7% |
| Sub-Saharan Africans | 3.5 /100 | #231 | Tragic 96.7% |
| South American Indians | 3.5 /100 | #232 | Tragic 96.7% |
| Yuman | 3.2 /100 | #233 | Tragic 96.7% |
| Uruguayans | 2.5 /100 | #234 | Tragic 96.6% |
| Asians | 2.4 /100 | #235 | Tragic 96.6% |
| Immigrants | Indonesia | 2.3 /100 | #236 | Tragic 96.6% |
| Immigrants | Eastern Africa | 2.0 /100 | #237 | Tragic 96.6% |
| Nigerians | 1.9 /100 | #238 | Tragic 96.6% |