Cheyenne vs Immigrants from Sierra Leone Associate's Degree
COMPARE
Cheyenne
Immigrants from Sierra Leone
Associate's Degree
Associate's Degree Comparison
Cheyenne
Immigrants from Sierra Leone
38.7%
ASSOCIATE'S DEGREE
0.0/ 100
METRIC RATING
298th/ 347
METRIC RANK
46.7%
ASSOCIATE'S DEGREE
59.2/ 100
METRIC RATING
167th/ 347
METRIC RANK
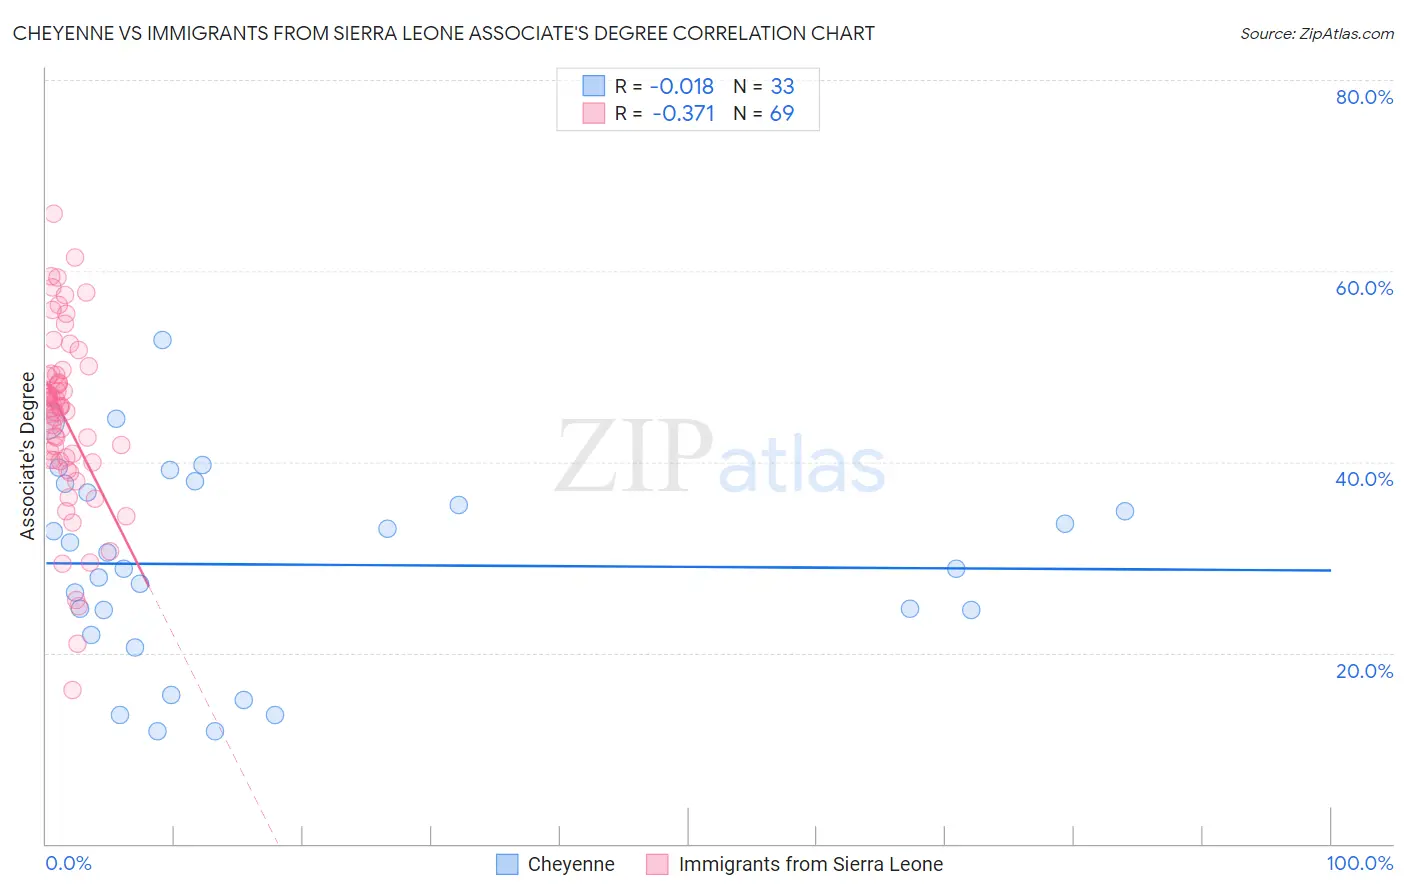
Cheyenne vs Immigrants from Sierra Leone Associate's Degree Correlation Chart
The statistical analysis conducted on geographies consisting of 80,719,085 people shows no correlation between the proportion of Cheyenne and percentage of population with at least associate's degree education in the United States with a correlation coefficient (R) of -0.018 and weighted average of 38.7%. Similarly, the statistical analysis conducted on geographies consisting of 101,624,736 people shows a mild negative correlation between the proportion of Immigrants from Sierra Leone and percentage of population with at least associate's degree education in the United States with a correlation coefficient (R) of -0.371 and weighted average of 46.7%, a difference of 20.7%.
Associate's Degree Correlation Summary
| Measurement | Cheyenne | Immigrants from Sierra Leone |
| Minimum | 11.8% | 16.1% |
| Maximum | 52.8% | 66.0% |
| Range | 41.1% | 50.0% |
| Mean | 29.2% | 44.5% |
| Median | 28.8% | 45.7% |
| Interquartile 25% (IQ1) | 23.2% | 40.1% |
| Interquartile 75% (IQ3) | 37.3% | 49.2% |
| Interquartile Range (IQR) | 14.1% | 9.1% |
| Standard Deviation (Sample) | 10.3% | 9.5% |
| Standard Deviation (Population) | 10.1% | 9.4% |
Similar Demographics by Associate's Degree
Demographics Similar to Cheyenne by Associate's Degree
In terms of associate's degree, the demographic groups most similar to Cheyenne are Ute (38.6%, a difference of 0.090%), Chickasaw (38.6%, a difference of 0.13%), Tsimshian (38.6%, a difference of 0.19%), Cape Verdean (38.8%, a difference of 0.26%), and Colville (38.5%, a difference of 0.34%).
| Demographics | Rating | Rank | Associate's Degree |
| Dominicans | 0.0 /100 | #291 | Tragic 39.3% |
| Blacks/African Americans | 0.0 /100 | #292 | Tragic 39.1% |
| Nepalese | 0.0 /100 | #293 | Tragic 39.0% |
| Salvadorans | 0.0 /100 | #294 | Tragic 39.0% |
| Hondurans | 0.0 /100 | #295 | Tragic 38.9% |
| Cherokee | 0.0 /100 | #296 | Tragic 38.9% |
| Cape Verdeans | 0.0 /100 | #297 | Tragic 38.8% |
| Cheyenne | 0.0 /100 | #298 | Tragic 38.7% |
| Ute | 0.0 /100 | #299 | Tragic 38.6% |
| Chickasaw | 0.0 /100 | #300 | Tragic 38.6% |
| Tsimshian | 0.0 /100 | #301 | Tragic 38.6% |
| Colville | 0.0 /100 | #302 | Tragic 38.5% |
| Guatemalans | 0.0 /100 | #303 | Tragic 38.5% |
| Sioux | 0.0 /100 | #304 | Tragic 38.5% |
| Immigrants | Honduras | 0.0 /100 | #305 | Tragic 38.5% |
Demographics Similar to Immigrants from Sierra Leone by Associate's Degree
In terms of associate's degree, the demographic groups most similar to Immigrants from Sierra Leone are Hungarian (46.7%, a difference of 0.010%), Immigrants from South America (46.7%, a difference of 0.050%), Colombian (46.8%, a difference of 0.25%), Somali (46.8%, a difference of 0.26%), and Immigrants from Somalia (46.5%, a difference of 0.29%).
| Demographics | Rating | Rank | Associate's Degree |
| Scottish | 65.4 /100 | #160 | Good 46.9% |
| Scandinavians | 65.2 /100 | #161 | Good 46.9% |
| Immigrants | Africa | 63.2 /100 | #162 | Good 46.8% |
| Somalis | 62.5 /100 | #163 | Good 46.8% |
| Colombians | 62.4 /100 | #164 | Good 46.8% |
| Immigrants | South America | 59.9 /100 | #165 | Average 46.7% |
| Hungarians | 59.3 /100 | #166 | Average 46.7% |
| Immigrants | Sierra Leone | 59.2 /100 | #167 | Average 46.7% |
| Immigrants | Somalia | 55.5 /100 | #168 | Average 46.5% |
| Uruguayans | 55.4 /100 | #169 | Average 46.5% |
| Irish | 53.6 /100 | #170 | Average 46.5% |
| Basques | 52.8 /100 | #171 | Average 46.5% |
| Peruvians | 50.5 /100 | #172 | Average 46.4% |
| Immigrants | Iraq | 50.3 /100 | #173 | Average 46.4% |
| English | 50.0 /100 | #174 | Average 46.4% |