Chickasaw vs Iraqi Doctorate Degree
COMPARE
Chickasaw
Iraqi
Doctorate Degree
Doctorate Degree Comparison
Chickasaw
Iraqis
1.5%
DOCTORATE DEGREE
0.7/ 100
METRIC RATING
262nd/ 347
METRIC RANK
1.8%
DOCTORATE DEGREE
49.2/ 100
METRIC RATING
177th/ 347
METRIC RANK
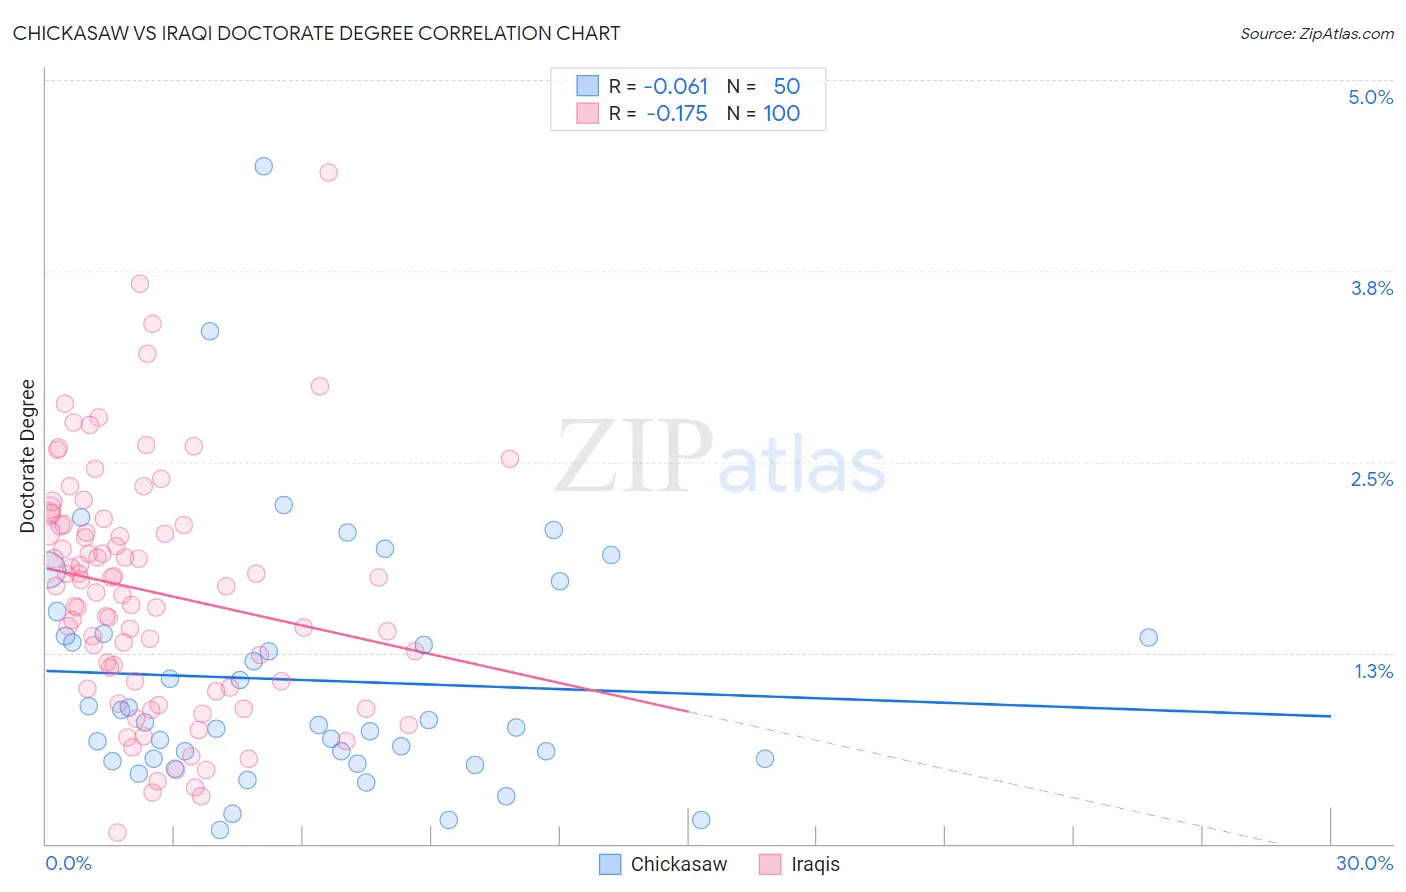
Chickasaw vs Iraqi Doctorate Degree Correlation Chart
The statistical analysis conducted on geographies consisting of 146,327,093 people shows a slight negative correlation between the proportion of Chickasaw and percentage of population with at least doctorate degree education in the United States with a correlation coefficient (R) of -0.061 and weighted average of 1.5%. Similarly, the statistical analysis conducted on geographies consisting of 170,189,095 people shows a poor negative correlation between the proportion of Iraqis and percentage of population with at least doctorate degree education in the United States with a correlation coefficient (R) of -0.175 and weighted average of 1.8%, a difference of 21.7%.
Doctorate Degree Correlation Summary
| Measurement | Chickasaw | Iraqi |
| Minimum | 0.090% | 0.073% |
| Maximum | 4.4% | 4.4% |
| Range | 4.3% | 4.3% |
| Mean | 1.1% | 1.7% |
| Median | 0.79% | 1.7% |
| Interquartile 25% (IQ1) | 0.56% | 1.0% |
| Interquartile 75% (IQ3) | 1.4% | 2.1% |
| Interquartile Range (IQR) | 0.80% | 1.0% |
| Standard Deviation (Sample) | 0.82% | 0.79% |
| Standard Deviation (Population) | 0.81% | 0.79% |
Similar Demographics by Doctorate Degree
Demographics Similar to Chickasaw by Doctorate Degree
In terms of doctorate degree, the demographic groups most similar to Chickasaw are Immigrants from Portugal (1.5%, a difference of 0.15%), Immigrants from Bahamas (1.5%, a difference of 0.17%), Blackfeet (1.5%, a difference of 0.36%), Japanese (1.5%, a difference of 0.61%), and Nicaraguan (1.5%, a difference of 0.64%).
| Demographics | Rating | Rank | Doctorate Degree |
| Trinidadians and Tobagonians | 1.0 /100 | #255 | Tragic 1.5% |
| Central American Indians | 1.0 /100 | #256 | Tragic 1.5% |
| Chippewa | 0.9 /100 | #257 | Tragic 1.5% |
| Immigrants | West Indies | 0.9 /100 | #258 | Tragic 1.5% |
| Liberians | 0.9 /100 | #259 | Tragic 1.5% |
| Japanese | 0.9 /100 | #260 | Tragic 1.5% |
| Immigrants | Portugal | 0.8 /100 | #261 | Tragic 1.5% |
| Chickasaw | 0.7 /100 | #262 | Tragic 1.5% |
| Immigrants | Bahamas | 0.7 /100 | #263 | Tragic 1.5% |
| Blackfeet | 0.7 /100 | #264 | Tragic 1.5% |
| Nicaraguans | 0.6 /100 | #265 | Tragic 1.5% |
| Immigrants | Liberia | 0.5 /100 | #266 | Tragic 1.5% |
| Kiowa | 0.5 /100 | #267 | Tragic 1.5% |
| U.S. Virgin Islanders | 0.5 /100 | #268 | Tragic 1.5% |
| Crow | 0.5 /100 | #269 | Tragic 1.5% |
Demographics Similar to Iraqis by Doctorate Degree
In terms of doctorate degree, the demographic groups most similar to Iraqis are Spanish (1.8%, a difference of 0.010%), Immigrants from Thailand (1.8%, a difference of 0.030%), French (1.8%, a difference of 0.060%), Immigrants from Bangladesh (1.8%, a difference of 0.11%), and Norwegian (1.8%, a difference of 0.12%).
| Demographics | Rating | Rank | Doctorate Degree |
| Costa Ricans | 53.3 /100 | #170 | Average 1.8% |
| Bermudans | 52.1 /100 | #171 | Average 1.8% |
| Belgians | 50.3 /100 | #172 | Average 1.8% |
| Norwegians | 50.0 /100 | #173 | Average 1.8% |
| Immigrants | Bangladesh | 50.0 /100 | #174 | Average 1.8% |
| Immigrants | Thailand | 49.4 /100 | #175 | Average 1.8% |
| Spanish | 49.3 /100 | #176 | Average 1.8% |
| Iraqis | 49.2 /100 | #177 | Average 1.8% |
| French | 48.8 /100 | #178 | Average 1.8% |
| Ghanaians | 48.3 /100 | #179 | Average 1.8% |
| Scandinavians | 48.0 /100 | #180 | Average 1.8% |
| Immigrants | Immigrants | 46.2 /100 | #181 | Average 1.8% |
| Immigrants | Afghanistan | 44.3 /100 | #182 | Average 1.8% |
| Finns | 42.1 /100 | #183 | Average 1.8% |
| Nigerians | 39.9 /100 | #184 | Fair 1.8% |