Choctaw vs Alaska Native 12th Grade, No Diploma
COMPARE
Choctaw
Alaska Native
12th Grade, No Diploma
12th Grade, No Diploma Comparison
Choctaw
Alaska Natives
89.8%
12TH GRADE, NO DIPLOMA
0.7/ 100
METRIC RATING
253rd/ 347
METRIC RANK
91.6%
12TH GRADE, NO DIPLOMA
84.9/ 100
METRIC RATING
137th/ 347
METRIC RANK
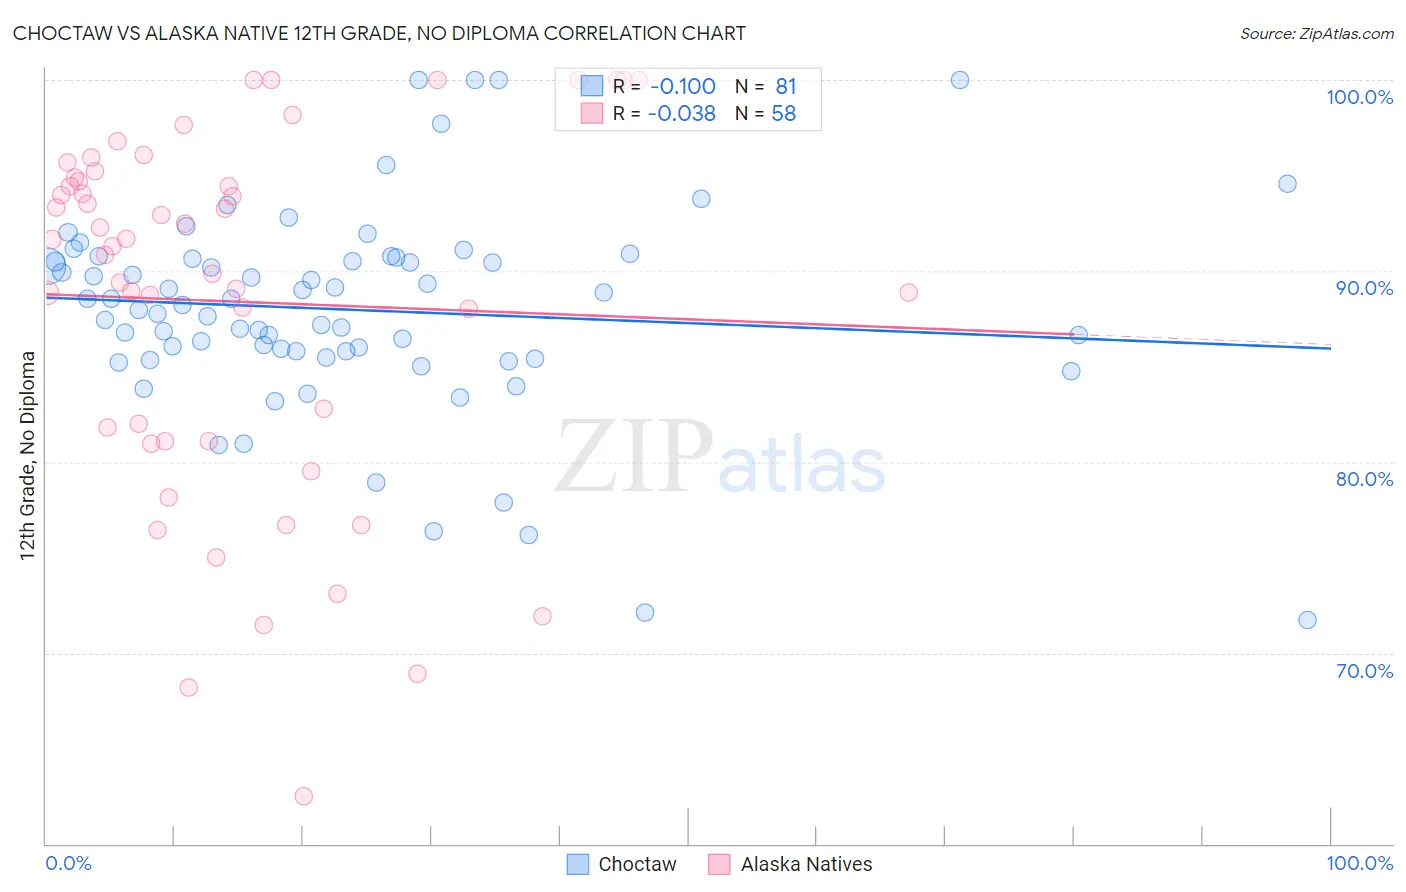
Choctaw vs Alaska Native 12th Grade, No Diploma Correlation Chart
The statistical analysis conducted on geographies consisting of 269,738,650 people shows a slight negative correlation between the proportion of Choctaw and percentage of population with at least 12th grade (no diploma) education in the United States with a correlation coefficient (R) of -0.100 and weighted average of 89.8%. Similarly, the statistical analysis conducted on geographies consisting of 76,778,789 people shows no correlation between the proportion of Alaska Natives and percentage of population with at least 12th grade (no diploma) education in the United States with a correlation coefficient (R) of -0.038 and weighted average of 91.6%, a difference of 2.1%.
12th Grade, No Diploma Correlation Summary
| Measurement | Choctaw | Alaska Native |
| Minimum | 71.7% | 62.5% |
| Maximum | 100.0% | 100.0% |
| Range | 28.3% | 37.5% |
| Mean | 88.0% | 88.4% |
| Median | 88.2% | 91.5% |
| Interquartile 25% (IQ1) | 85.6% | 81.1% |
| Interquartile 75% (IQ3) | 90.7% | 94.9% |
| Interquartile Range (IQR) | 5.0% | 13.8% |
| Standard Deviation (Sample) | 5.4% | 9.5% |
| Standard Deviation (Population) | 5.3% | 9.4% |
Similar Demographics by 12th Grade, No Diploma
Demographics Similar to Choctaw by 12th Grade, No Diploma
In terms of 12th grade, no diploma, the demographic groups most similar to Choctaw are Bahamian (89.9%, a difference of 0.080%), Spanish American (89.9%, a difference of 0.090%), Immigrants from Peru (89.7%, a difference of 0.090%), Immigrants from Eritrea (89.9%, a difference of 0.10%), and Immigrants from Senegal (89.7%, a difference of 0.10%).
| Demographics | Rating | Rank | 12th Grade, No Diploma |
| Ghanaians | 1.3 /100 | #246 | Tragic 90.0% |
| Immigrants | Nigeria | 1.3 /100 | #247 | Tragic 89.9% |
| Comanche | 1.1 /100 | #248 | Tragic 89.9% |
| Senegalese | 1.1 /100 | #249 | Tragic 89.9% |
| Immigrants | Eritrea | 1.0 /100 | #250 | Tragic 89.9% |
| Spanish Americans | 0.9 /100 | #251 | Tragic 89.9% |
| Bahamians | 0.9 /100 | #252 | Tragic 89.9% |
| Choctaw | 0.7 /100 | #253 | Tragic 89.8% |
| Immigrants | Peru | 0.5 /100 | #254 | Tragic 89.7% |
| Immigrants | Senegal | 0.5 /100 | #255 | Tragic 89.7% |
| Immigrants | Ghana | 0.5 /100 | #256 | Tragic 89.7% |
| Jamaicans | 0.5 /100 | #257 | Tragic 89.7% |
| Africans | 0.4 /100 | #258 | Tragic 89.6% |
| Immigrants | Western Africa | 0.4 /100 | #259 | Tragic 89.6% |
| Immigrants | South Eastern Asia | 0.4 /100 | #260 | Tragic 89.6% |
Demographics Similar to Alaska Natives by 12th Grade, No Diploma
In terms of 12th grade, no diploma, the demographic groups most similar to Alaska Natives are Chilean (91.7%, a difference of 0.020%), Arab (91.6%, a difference of 0.020%), Immigrants from Egypt (91.6%, a difference of 0.020%), Immigrants from Bosnia and Herzegovina (91.7%, a difference of 0.060%), and Immigrants from Poland (91.6%, a difference of 0.060%).
| Demographics | Rating | Rank | 12th Grade, No Diploma |
| Assyrians/Chaldeans/Syriacs | 89.6 /100 | #130 | Excellent 91.8% |
| Albanians | 89.3 /100 | #131 | Excellent 91.8% |
| Immigrants | Eastern Asia | 89.3 /100 | #132 | Excellent 91.8% |
| Immigrants | Italy | 88.3 /100 | #133 | Excellent 91.7% |
| Venezuelans | 88.2 /100 | #134 | Excellent 91.7% |
| Immigrants | Bosnia and Herzegovina | 87.3 /100 | #135 | Excellent 91.7% |
| Chileans | 85.8 /100 | #136 | Excellent 91.7% |
| Alaska Natives | 84.9 /100 | #137 | Excellent 91.6% |
| Arabs | 84.1 /100 | #138 | Excellent 91.6% |
| Immigrants | Egypt | 83.9 /100 | #139 | Excellent 91.6% |
| Immigrants | Poland | 82.3 /100 | #140 | Excellent 91.6% |
| Argentineans | 82.0 /100 | #141 | Excellent 91.6% |
| Immigrants | Venezuela | 80.9 /100 | #142 | Excellent 91.6% |
| Immigrants | Argentina | 80.7 /100 | #143 | Excellent 91.6% |
| Immigrants | Spain | 80.1 /100 | #144 | Excellent 91.6% |