Colombian vs Immigrants from Panama 4th Grade
COMPARE
Colombian
Immigrants from Panama
4th Grade
4th Grade Comparison
Colombians
Immigrants from Panama
97.1%
4TH GRADE
1.6/ 100
METRIC RATING
240th/ 347
METRIC RANK
97.3%
4TH GRADE
5.4/ 100
METRIC RATING
221st/ 347
METRIC RANK
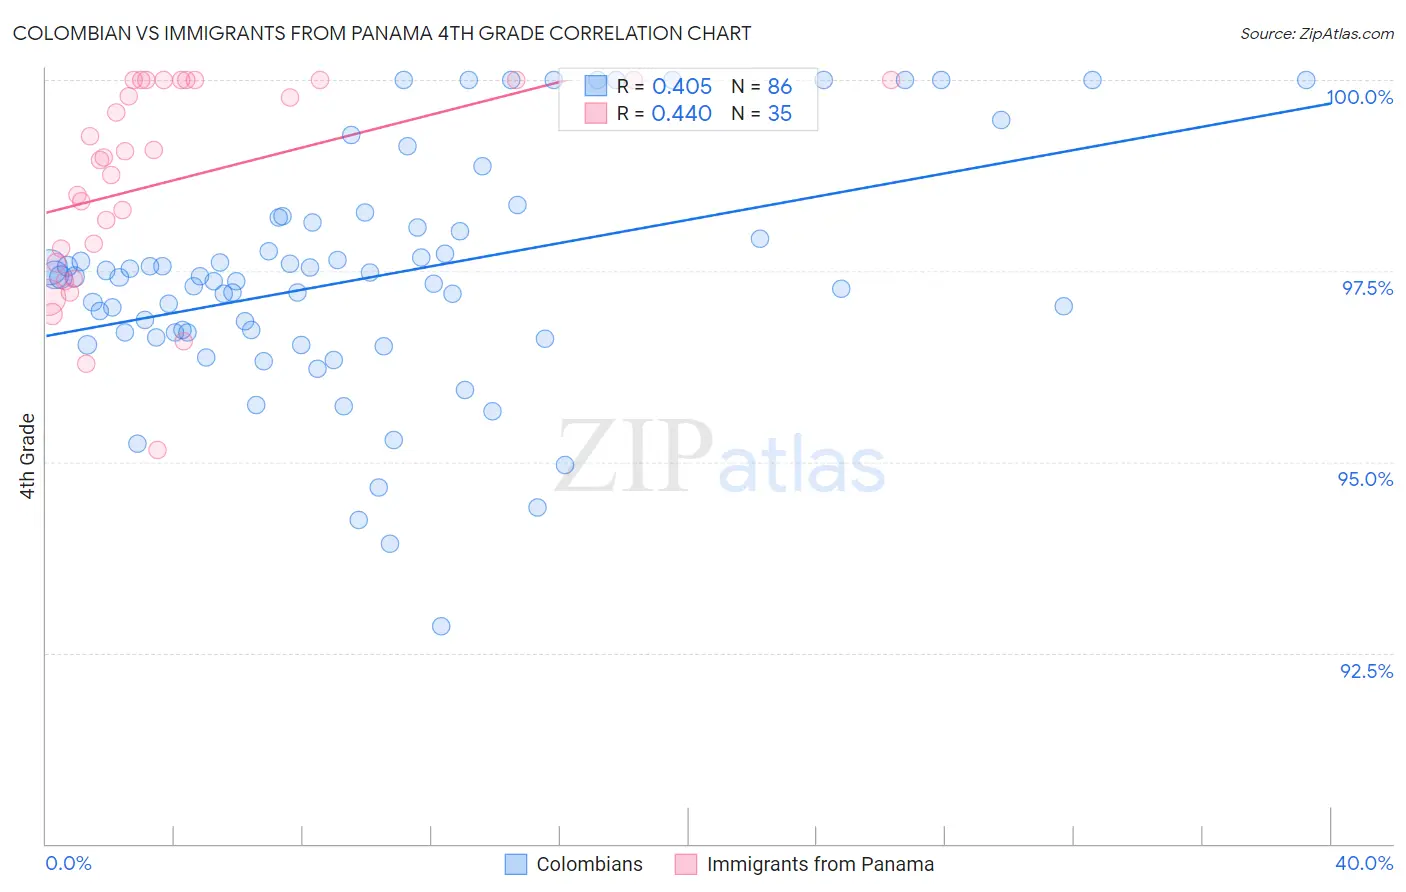
Colombian vs Immigrants from Panama 4th Grade Correlation Chart
The statistical analysis conducted on geographies consisting of 419,700,680 people shows a moderate positive correlation between the proportion of Colombians and percentage of population with at least 4th grade education in the United States with a correlation coefficient (R) of 0.405 and weighted average of 97.1%. Similarly, the statistical analysis conducted on geographies consisting of 221,182,871 people shows a moderate positive correlation between the proportion of Immigrants from Panama and percentage of population with at least 4th grade education in the United States with a correlation coefficient (R) of 0.440 and weighted average of 97.3%, a difference of 0.12%.
4th Grade Correlation Summary
| Measurement | Colombian | Immigrants from Panama |
| Minimum | 92.9% | 95.1% |
| Maximum | 100.0% | 100.0% |
| Range | 7.1% | 4.9% |
| Mean | 97.4% | 98.7% |
| Median | 97.4% | 99.0% |
| Interquartile 25% (IQ1) | 96.7% | 97.6% |
| Interquartile 75% (IQ3) | 98.1% | 100.0% |
| Interquartile Range (IQR) | 1.4% | 2.4% |
| Standard Deviation (Sample) | 1.5% | 1.3% |
| Standard Deviation (Population) | 1.5% | 1.3% |
Demographics Similar to Colombians and Immigrants from Panama by 4th Grade
In terms of 4th grade, the demographic groups most similar to Colombians are Nigerian (97.1%, a difference of 0.010%), Immigrants from Costa Rica (97.2%, a difference of 0.020%), Indian (Asian) (97.2%, a difference of 0.020%), Immigrants from Eastern Asia (97.2%, a difference of 0.050%), and Senegalese (97.2%, a difference of 0.060%). Similarly, the demographic groups most similar to Immigrants from Panama are South American Indian (97.3%, a difference of 0.0%), Immigrants from Lebanon (97.3%, a difference of 0.010%), Immigrants from Sudan (97.2%, a difference of 0.010%), Immigrants from Syria (97.2%, a difference of 0.010%), and Immigrants from Iraq (97.2%, a difference of 0.020%).
| Demographics | Rating | Rank | 4th Grade |
| South American Indians | 5.5 /100 | #220 | Tragic 97.3% |
| Immigrants | Panama | 5.4 /100 | #221 | Tragic 97.3% |
| Immigrants | Lebanon | 5.1 /100 | #222 | Tragic 97.3% |
| Immigrants | Sudan | 5.0 /100 | #223 | Tragic 97.2% |
| Immigrants | Syria | 5.0 /100 | #224 | Tragic 97.2% |
| Immigrants | Iraq | 4.6 /100 | #225 | Tragic 97.2% |
| Bahamians | 3.8 /100 | #226 | Tragic 97.2% |
| Immigrants | Pakistan | 3.7 /100 | #227 | Tragic 97.2% |
| Sub-Saharan Africans | 3.6 /100 | #228 | Tragic 97.2% |
| Liberians | 3.6 /100 | #229 | Tragic 97.2% |
| Uruguayans | 3.5 /100 | #230 | Tragic 97.2% |
| Immigrants | Malaysia | 3.4 /100 | #231 | Tragic 97.2% |
| Immigrants | Western Asia | 3.4 /100 | #232 | Tragic 97.2% |
| Senegalese | 3.1 /100 | #233 | Tragic 97.2% |
| Assyrians/Chaldeans/Syriacs | 3.0 /100 | #234 | Tragic 97.2% |
| Yuman | 2.9 /100 | #235 | Tragic 97.2% |
| Immigrants | Eastern Asia | 2.7 /100 | #236 | Tragic 97.2% |
| Immigrants | Costa Rica | 2.0 /100 | #237 | Tragic 97.2% |
| Indians (Asian) | 1.9 /100 | #238 | Tragic 97.2% |
| Nigerians | 1.8 /100 | #239 | Tragic 97.1% |
| Colombians | 1.6 /100 | #240 | Tragic 97.1% |