Colombian vs Menominee 9th Grade
COMPARE
Colombian
Menominee
9th Grade
9th Grade Comparison
Colombians
Menominee
94.0%
9TH GRADE
0.8/ 100
METRIC RATING
253rd/ 347
METRIC RANK
95.6%
9TH GRADE
98.3/ 100
METRIC RATING
99th/ 347
METRIC RANK
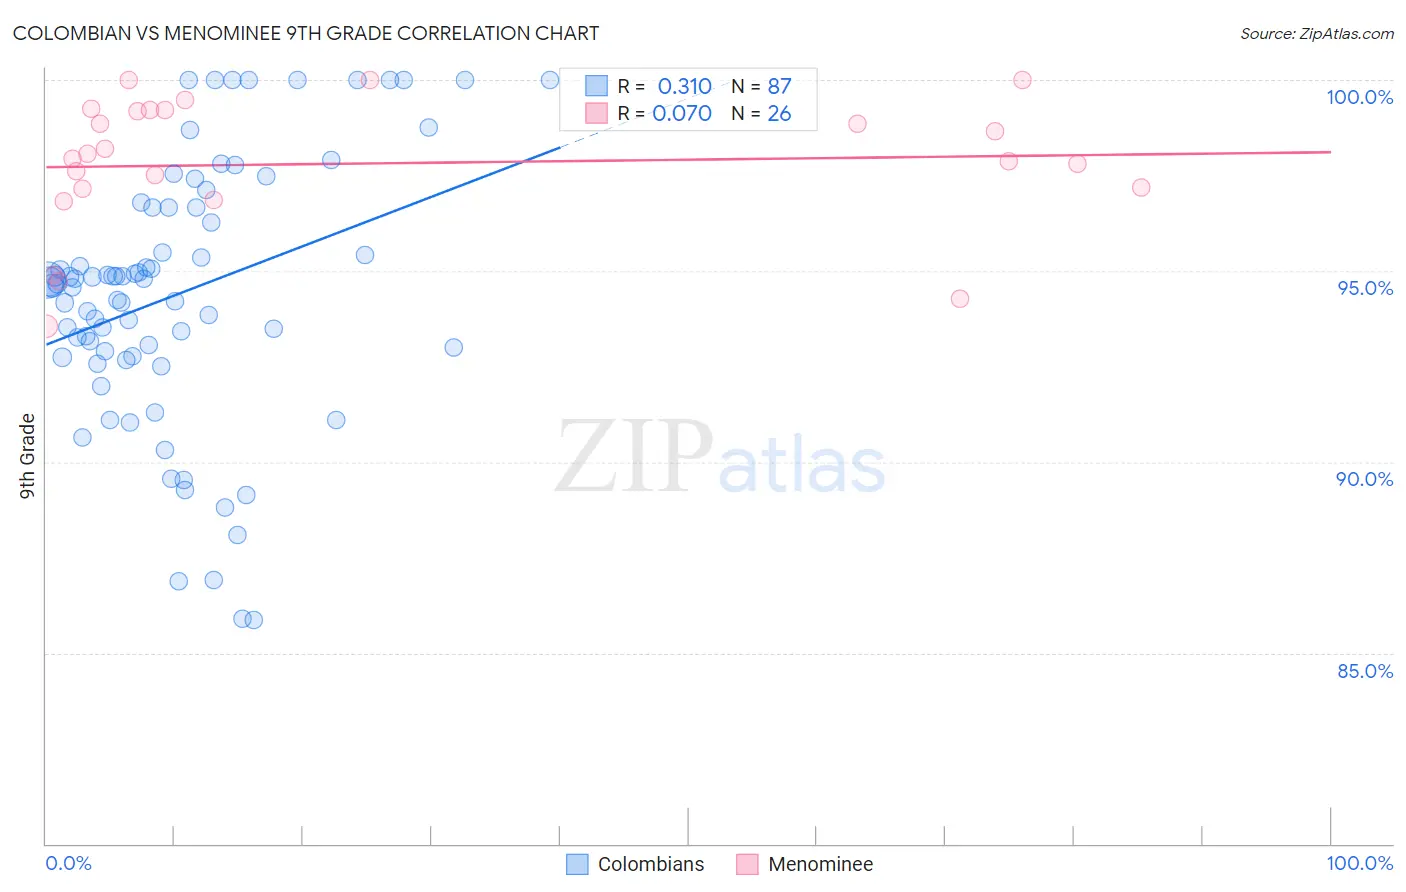
Colombian vs Menominee 9th Grade Correlation Chart
The statistical analysis conducted on geographies consisting of 419,655,116 people shows a mild positive correlation between the proportion of Colombians and percentage of population with at least 9th grade education in the United States with a correlation coefficient (R) of 0.310 and weighted average of 94.0%. Similarly, the statistical analysis conducted on geographies consisting of 45,778,979 people shows a slight positive correlation between the proportion of Menominee and percentage of population with at least 9th grade education in the United States with a correlation coefficient (R) of 0.070 and weighted average of 95.6%, a difference of 1.6%.
9th Grade Correlation Summary
| Measurement | Colombian | Menominee |
| Minimum | 85.8% | 93.6% |
| Maximum | 100.0% | 100.0% |
| Range | 14.2% | 6.4% |
| Mean | 94.4% | 97.8% |
| Median | 94.7% | 98.0% |
| Interquartile 25% (IQ1) | 92.8% | 97.2% |
| Interquartile 75% (IQ3) | 96.7% | 99.2% |
| Interquartile Range (IQR) | 3.9% | 2.1% |
| Standard Deviation (Sample) | 3.4% | 1.8% |
| Standard Deviation (Population) | 3.4% | 1.7% |
Similar Demographics by 9th Grade
Demographics Similar to Colombians by 9th Grade
In terms of 9th grade, the demographic groups most similar to Colombians are Immigrants from Senegal (94.1%, a difference of 0.020%), Jamaican (94.1%, a difference of 0.030%), U.S. Virgin Islander (94.0%, a difference of 0.030%), Immigrants from Nigeria (94.0%, a difference of 0.070%), and Uruguayan (94.1%, a difference of 0.080%).
| Demographics | Rating | Rank | 9th Grade |
| Senegalese | 1.9 /100 | #246 | Tragic 94.2% |
| Afghans | 1.8 /100 | #247 | Tragic 94.2% |
| Immigrants | Somalia | 1.4 /100 | #248 | Tragic 94.1% |
| Uruguayans | 1.3 /100 | #249 | Tragic 94.1% |
| Immigrants | Hong Kong | 1.3 /100 | #250 | Tragic 94.1% |
| Jamaicans | 1.0 /100 | #251 | Tragic 94.1% |
| Immigrants | Senegal | 0.9 /100 | #252 | Tragic 94.1% |
| Colombians | 0.8 /100 | #253 | Tragic 94.0% |
| U.S. Virgin Islanders | 0.7 /100 | #254 | Tragic 94.0% |
| Immigrants | Nigeria | 0.6 /100 | #255 | Tragic 94.0% |
| Immigrants | Afghanistan | 0.5 /100 | #256 | Tragic 94.0% |
| Immigrants | Costa Rica | 0.5 /100 | #257 | Tragic 94.0% |
| Immigrants | Thailand | 0.5 /100 | #258 | Tragic 93.9% |
| Ghanaians | 0.5 /100 | #259 | Tragic 93.9% |
| Pima | 0.4 /100 | #260 | Tragic 93.9% |
Demographics Similar to Menominee by 9th Grade
In terms of 9th grade, the demographic groups most similar to Menominee are Immigrants from Japan (95.6%, a difference of 0.0%), Delaware (95.6%, a difference of 0.010%), American (95.6%, a difference of 0.020%), Filipino (95.6%, a difference of 0.020%), and Lebanese (95.6%, a difference of 0.020%).
| Demographics | Rating | Rank | 9th Grade |
| Immigrants | Saudi Arabia | 98.8 /100 | #92 | Exceptional 95.6% |
| Immigrants | Germany | 98.7 /100 | #93 | Exceptional 95.6% |
| Immigrants | Latvia | 98.7 /100 | #94 | Exceptional 95.6% |
| Americans | 98.5 /100 | #95 | Exceptional 95.6% |
| Filipinos | 98.5 /100 | #96 | Exceptional 95.6% |
| Delaware | 98.4 /100 | #97 | Exceptional 95.6% |
| Immigrants | Japan | 98.4 /100 | #98 | Exceptional 95.6% |
| Menominee | 98.3 /100 | #99 | Exceptional 95.6% |
| Lebanese | 98.1 /100 | #100 | Exceptional 95.6% |
| Immigrants | Moldova | 97.9 /100 | #101 | Exceptional 95.5% |
| Immigrants | Switzerland | 97.7 /100 | #102 | Exceptional 95.5% |
| Potawatomi | 97.7 /100 | #103 | Exceptional 95.5% |
| Syrians | 97.4 /100 | #104 | Exceptional 95.5% |
| Immigrants | France | 97.4 /100 | #105 | Exceptional 95.5% |
| Immigrants | Norway | 97.1 /100 | #106 | Exceptional 95.5% |