Costa Rican vs Estonian 6th Grade
COMPARE
Costa Rican
Estonian
6th Grade
6th Grade Comparison
Costa Ricans
Estonians
96.8%
6TH GRADE
6.8/ 100
METRIC RATING
219th/ 347
METRIC RANK
97.8%
6TH GRADE
99.8/ 100
METRIC RATING
49th/ 347
METRIC RANK
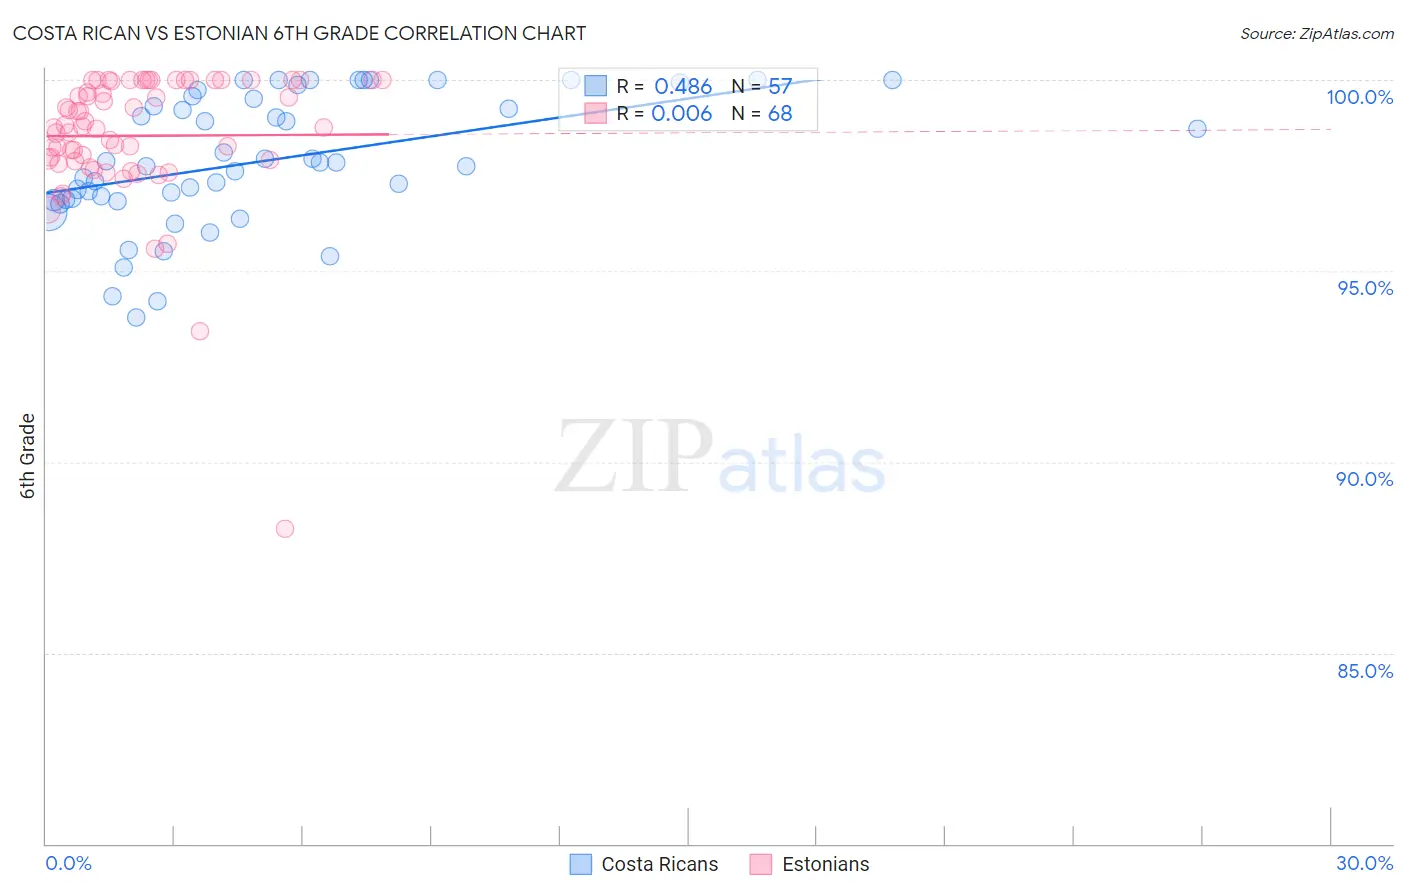
Costa Rican vs Estonian 6th Grade Correlation Chart
The statistical analysis conducted on geographies consisting of 253,599,979 people shows a moderate positive correlation between the proportion of Costa Ricans and percentage of population with at least 6th grade education in the United States with a correlation coefficient (R) of 0.486 and weighted average of 96.8%. Similarly, the statistical analysis conducted on geographies consisting of 123,528,404 people shows no correlation between the proportion of Estonians and percentage of population with at least 6th grade education in the United States with a correlation coefficient (R) of 0.006 and weighted average of 97.8%, a difference of 1.1%.
6th Grade Correlation Summary
| Measurement | Costa Rican | Estonian |
| Minimum | 93.8% | 88.3% |
| Maximum | 100.0% | 100.0% |
| Range | 6.2% | 11.7% |
| Mean | 97.9% | 98.5% |
| Median | 97.9% | 98.8% |
| Interquartile 25% (IQ1) | 96.9% | 97.9% |
| Interquartile 75% (IQ3) | 99.5% | 100.0% |
| Interquartile Range (IQR) | 2.7% | 2.1% |
| Standard Deviation (Sample) | 1.7% | 1.8% |
| Standard Deviation (Population) | 1.7% | 1.8% |
Similar Demographics by 6th Grade
Demographics Similar to Costa Ricans by 6th Grade
In terms of 6th grade, the demographic groups most similar to Costa Ricans are Liberian (96.8%, a difference of 0.010%), Navajo (96.8%, a difference of 0.010%), Immigrants from Morocco (96.7%, a difference of 0.010%), Tongan (96.7%, a difference of 0.010%), and Portuguese (96.8%, a difference of 0.020%).
| Demographics | Rating | Rank | 6th Grade |
| Moroccans | 9.0 /100 | #212 | Tragic 96.8% |
| Immigrants | Sudan | 8.7 /100 | #213 | Tragic 96.8% |
| Portuguese | 8.2 /100 | #214 | Tragic 96.8% |
| Sierra Leoneans | 8.0 /100 | #215 | Tragic 96.8% |
| Paiute | 7.8 /100 | #216 | Tragic 96.8% |
| Liberians | 7.5 /100 | #217 | Tragic 96.8% |
| Navajo | 7.3 /100 | #218 | Tragic 96.8% |
| Costa Ricans | 6.8 /100 | #219 | Tragic 96.8% |
| Immigrants | Morocco | 6.2 /100 | #220 | Tragic 96.7% |
| Tongans | 6.1 /100 | #221 | Tragic 96.7% |
| Immigrants | Syria | 5.9 /100 | #222 | Tragic 96.7% |
| Bahamians | 4.8 /100 | #223 | Tragic 96.7% |
| Immigrants | Southern Europe | 4.4 /100 | #224 | Tragic 96.7% |
| Immigrants | Pakistan | 4.4 /100 | #225 | Tragic 96.7% |
| Immigrants | Panama | 4.2 /100 | #226 | Tragic 96.7% |
Demographics Similar to Estonians by 6th Grade
In terms of 6th grade, the demographic groups most similar to Estonians are Native Hawaiian (97.8%, a difference of 0.0%), Celtic (97.8%, a difference of 0.0%), Immigrants from Scotland (97.8%, a difference of 0.0%), Arapaho (97.8%, a difference of 0.010%), and Maltese (97.8%, a difference of 0.010%).
| Demographics | Rating | Rank | 6th Grade |
| Hungarians | 99.9 /100 | #42 | Exceptional 97.8% |
| Northern Europeans | 99.9 /100 | #43 | Exceptional 97.8% |
| Czechoslovakians | 99.9 /100 | #44 | Exceptional 97.8% |
| Bulgarians | 99.9 /100 | #45 | Exceptional 97.8% |
| Arapaho | 99.9 /100 | #46 | Exceptional 97.8% |
| Native Hawaiians | 99.9 /100 | #47 | Exceptional 97.8% |
| Celtics | 99.9 /100 | #48 | Exceptional 97.8% |
| Estonians | 99.8 /100 | #49 | Exceptional 97.8% |
| Immigrants | Scotland | 99.8 /100 | #50 | Exceptional 97.8% |
| Maltese | 99.8 /100 | #51 | Exceptional 97.8% |
| Australians | 99.8 /100 | #52 | Exceptional 97.8% |
| Slavs | 99.8 /100 | #53 | Exceptional 97.8% |
| Creek | 99.8 /100 | #54 | Exceptional 97.7% |
| Aleuts | 99.8 /100 | #55 | Exceptional 97.7% |
| Austrians | 99.8 /100 | #56 | Exceptional 97.7% |