Creek vs Tsimshian 11th Grade
COMPARE
Creek
Tsimshian
11th Grade
11th Grade Comparison
Creek
Tsimshian
92.4%
11TH GRADE
40.9/ 100
METRIC RATING
179th/ 347
METRIC RANK
94.4%
11TH GRADE
100.0/ 100
METRIC RATING
22nd/ 347
METRIC RANK
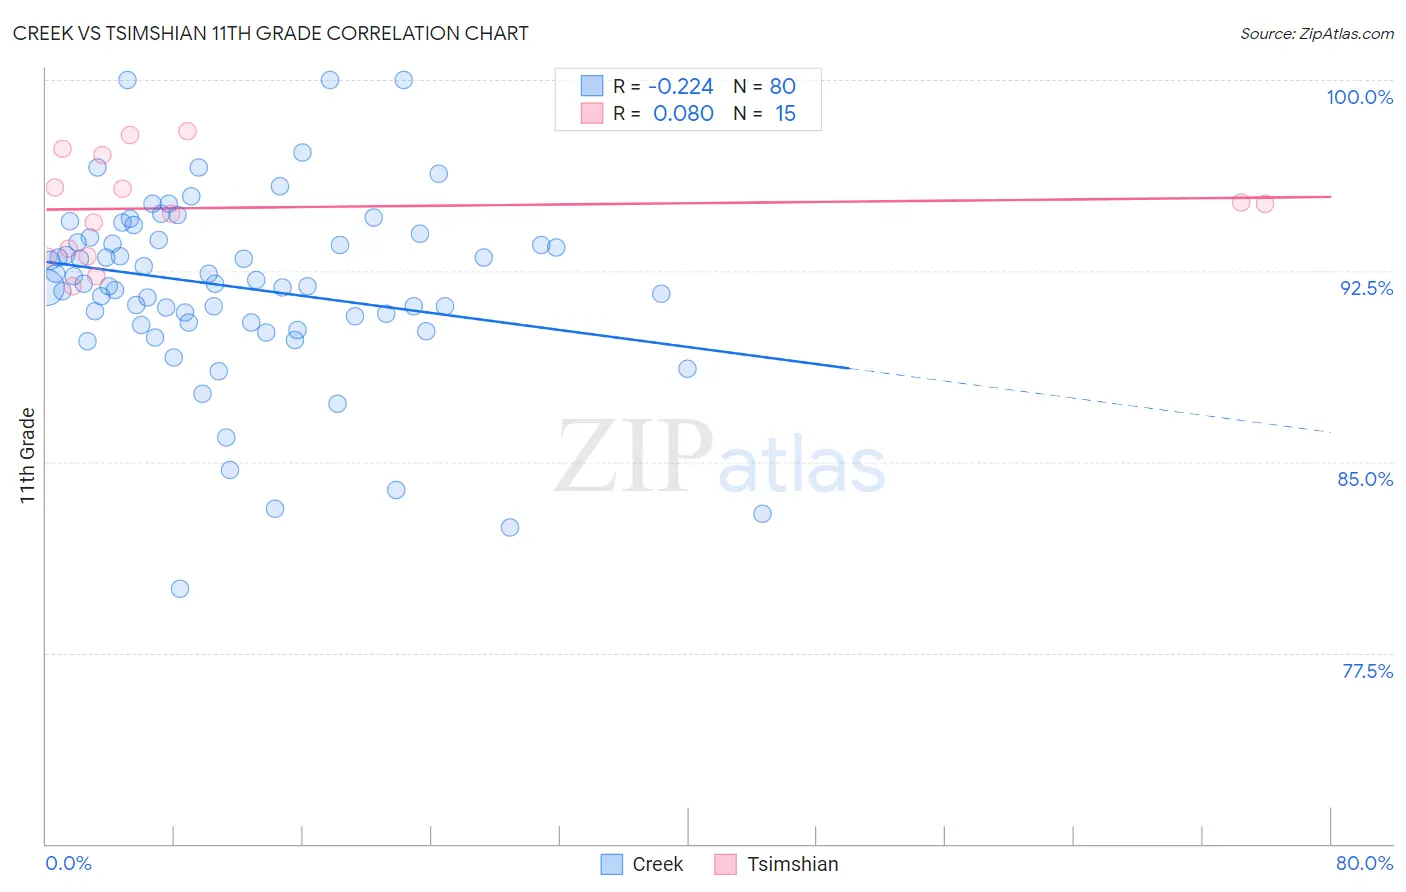
Creek vs Tsimshian 11th Grade Correlation Chart
The statistical analysis conducted on geographies consisting of 178,480,629 people shows a weak negative correlation between the proportion of Creek and percentage of population with at least 11th grade education in the United States with a correlation coefficient (R) of -0.224 and weighted average of 92.4%. Similarly, the statistical analysis conducted on geographies consisting of 15,626,544 people shows a slight positive correlation between the proportion of Tsimshian and percentage of population with at least 11th grade education in the United States with a correlation coefficient (R) of 0.080 and weighted average of 94.4%, a difference of 2.2%.
11th Grade Correlation Summary
| Measurement | Creek | Tsimshian |
| Minimum | 80.0% | 91.9% |
| Maximum | 100.0% | 98.0% |
| Range | 20.0% | 6.1% |
| Mean | 91.9% | 95.0% |
| Median | 92.0% | 95.1% |
| Interquartile 25% (IQ1) | 90.5% | 93.1% |
| Interquartile 75% (IQ3) | 93.8% | 97.0% |
| Interquartile Range (IQR) | 3.3% | 4.0% |
| Standard Deviation (Sample) | 3.7% | 2.0% |
| Standard Deviation (Population) | 3.7% | 1.9% |
Similar Demographics by 11th Grade
Demographics Similar to Creek by 11th Grade
In terms of 11th grade, the demographic groups most similar to Creek are Inupiat (92.4%, a difference of 0.0%), Cherokee (92.4%, a difference of 0.0%), Sudanese (92.5%, a difference of 0.020%), Immigrants from Morocco (92.4%, a difference of 0.020%), and Immigrants from Malaysia (92.4%, a difference of 0.030%).
| Demographics | Rating | Rank | 11th Grade |
| Immigrants | Pakistan | 52.3 /100 | #172 | Average 92.5% |
| Indians (Asian) | 51.5 /100 | #173 | Average 92.5% |
| Asians | 50.0 /100 | #174 | Average 92.5% |
| Shoshone | 48.9 /100 | #175 | Average 92.5% |
| Spaniards | 46.9 /100 | #176 | Average 92.5% |
| Guamanians/Chamorros | 45.0 /100 | #177 | Average 92.5% |
| Sudanese | 43.4 /100 | #178 | Average 92.5% |
| Creek | 40.9 /100 | #179 | Average 92.4% |
| Inupiat | 40.7 /100 | #180 | Average 92.4% |
| Cherokee | 40.7 /100 | #181 | Average 92.4% |
| Immigrants | Morocco | 38.6 /100 | #182 | Fair 92.4% |
| Immigrants | Malaysia | 37.6 /100 | #183 | Fair 92.4% |
| Immigrants | Asia | 37.4 /100 | #184 | Fair 92.4% |
| Immigrants | Nepal | 36.4 /100 | #185 | Fair 92.4% |
| Arapaho | 35.1 /100 | #186 | Fair 92.4% |
Demographics Similar to Tsimshian by 11th Grade
In terms of 11th grade, the demographic groups most similar to Tsimshian are Czech (94.4%, a difference of 0.0%), Tlingit-Haida (94.4%, a difference of 0.010%), Italian (94.5%, a difference of 0.020%), English (94.4%, a difference of 0.030%), and Irish (94.4%, a difference of 0.050%).
| Demographics | Rating | Rank | 11th Grade |
| Bulgarians | 100.0 /100 | #15 | Exceptional 94.5% |
| Immigrants | India | 100.0 /100 | #16 | Exceptional 94.5% |
| Luxembourgers | 100.0 /100 | #17 | Exceptional 94.5% |
| Maltese | 100.0 /100 | #18 | Exceptional 94.5% |
| Scandinavians | 100.0 /100 | #19 | Exceptional 94.5% |
| Italians | 100.0 /100 | #20 | Exceptional 94.5% |
| Tlingit-Haida | 100.0 /100 | #21 | Exceptional 94.4% |
| Tsimshian | 100.0 /100 | #22 | Exceptional 94.4% |
| Czechs | 100.0 /100 | #23 | Exceptional 94.4% |
| English | 100.0 /100 | #24 | Exceptional 94.4% |
| Irish | 100.0 /100 | #25 | Exceptional 94.4% |
| Scottish | 100.0 /100 | #26 | Exceptional 94.4% |
| Europeans | 100.0 /100 | #27 | Exceptional 94.4% |
| Estonians | 100.0 /100 | #28 | Exceptional 94.4% |
| Dutch | 100.0 /100 | #29 | Exceptional 94.3% |