German vs Immigrants from Micronesia Nursery School
COMPARE
German
Immigrants from Micronesia
Nursery School
Nursery School Comparison
Germans
Immigrants from Micronesia
98.7%
NURSERY SCHOOL
100.0/ 100
METRIC RATING
10th/ 347
METRIC RANK
98.0%
NURSERY SCHOOL
55.0/ 100
METRIC RATING
168th/ 347
METRIC RANK
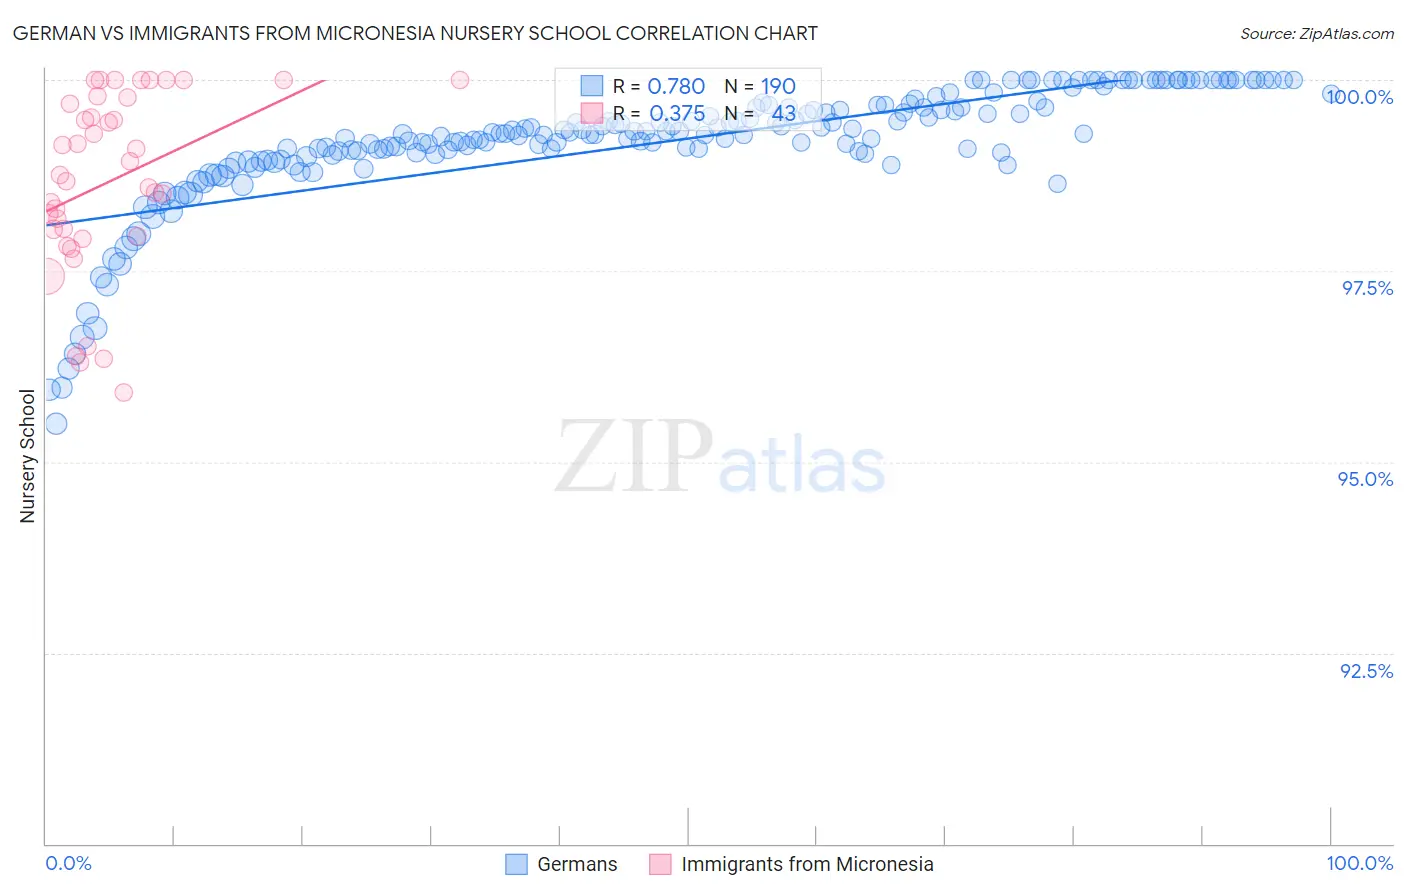
German vs Immigrants from Micronesia Nursery School Correlation Chart
The statistical analysis conducted on geographies consisting of 581,302,427 people shows a strong positive correlation between the proportion of Germans and percentage of population with at least nursery school education in the United States with a correlation coefficient (R) of 0.780 and weighted average of 98.7%. Similarly, the statistical analysis conducted on geographies consisting of 61,604,657 people shows a mild positive correlation between the proportion of Immigrants from Micronesia and percentage of population with at least nursery school education in the United States with a correlation coefficient (R) of 0.375 and weighted average of 98.0%, a difference of 0.74%.
Nursery School Correlation Summary
| Measurement | German | Immigrants from Micronesia |
| Minimum | 95.5% | 95.9% |
| Maximum | 100.0% | 100.0% |
| Range | 4.5% | 4.1% |
| Mean | 99.2% | 98.7% |
| Median | 99.3% | 98.8% |
| Interquartile 25% (IQ1) | 99.0% | 98.0% |
| Interquartile 75% (IQ3) | 99.6% | 99.8% |
| Interquartile Range (IQR) | 0.61% | 1.8% |
| Standard Deviation (Sample) | 0.81% | 1.2% |
| Standard Deviation (Population) | 0.81% | 1.2% |
Similar Demographics by Nursery School
Demographics Similar to Germans by Nursery School
In terms of nursery school, the demographic groups most similar to Germans are Slovak (98.7%, a difference of 0.0%), Tlingit-Haida (98.7%, a difference of 0.0%), Norwegian (98.7%, a difference of 0.020%), Slovene (98.7%, a difference of 0.020%), and Alaska Native (98.8%, a difference of 0.040%).
| Demographics | Rating | Rank | Nursery School |
| Welsh | 100.0 /100 | #3 | Exceptional 98.9% |
| Inupiat | 100.0 /100 | #4 | Exceptional 98.9% |
| Tsimshian | 100.0 /100 | #5 | Exceptional 98.9% |
| Alaskan Athabascans | 100.0 /100 | #6 | Exceptional 98.8% |
| Alaska Natives | 100.0 /100 | #7 | Exceptional 98.8% |
| Norwegians | 100.0 /100 | #8 | Exceptional 98.7% |
| Slovaks | 100.0 /100 | #9 | Exceptional 98.7% |
| Germans | 100.0 /100 | #10 | Exceptional 98.7% |
| Tlingit-Haida | 100.0 /100 | #11 | Exceptional 98.7% |
| Slovenes | 100.0 /100 | #12 | Exceptional 98.7% |
| English | 100.0 /100 | #13 | Exceptional 98.7% |
| Carpatho Rusyns | 100.0 /100 | #14 | Exceptional 98.7% |
| Swedes | 100.0 /100 | #15 | Exceptional 98.7% |
| Scottish | 100.0 /100 | #16 | Exceptional 98.7% |
| Aleuts | 100.0 /100 | #17 | Exceptional 98.7% |
Demographics Similar to Immigrants from Micronesia by Nursery School
In terms of nursery school, the demographic groups most similar to Immigrants from Micronesia are Ugandan (98.0%, a difference of 0.0%), Chilean (98.0%, a difference of 0.0%), Spanish American (98.0%, a difference of 0.0%), Immigrants from Spain (98.0%, a difference of 0.0%), and Immigrants from Korea (98.0%, a difference of 0.0%).
| Demographics | Rating | Rank | Nursery School |
| Immigrants | Eastern Europe | 59.7 /100 | #161 | Average 98.0% |
| Brazilians | 59.4 /100 | #162 | Average 98.0% |
| Immigrants | Italy | 59.0 /100 | #163 | Average 98.0% |
| Ugandans | 56.4 /100 | #164 | Average 98.0% |
| Chileans | 56.4 /100 | #165 | Average 98.0% |
| Spanish Americans | 55.6 /100 | #166 | Average 98.0% |
| Immigrants | Spain | 55.6 /100 | #167 | Average 98.0% |
| Immigrants | Micronesia | 55.0 /100 | #168 | Average 98.0% |
| Immigrants | Korea | 53.8 /100 | #169 | Average 98.0% |
| Bermudans | 53.7 /100 | #170 | Average 98.0% |
| Immigrants | Jordan | 53.4 /100 | #171 | Average 98.0% |
| Immigrants | Brazil | 51.3 /100 | #172 | Average 98.0% |
| Kenyans | 50.2 /100 | #173 | Average 98.0% |
| Navajo | 50.0 /100 | #174 | Average 98.0% |
| Immigrants | Sri Lanka | 49.9 /100 | #175 | Average 98.0% |