Guyanese vs Dutch 5th Grade
COMPARE
Guyanese
Dutch
5th Grade
5th Grade Comparison
Guyanese
Dutch
96.1%
5TH GRADE
0.0/ 100
METRIC RATING
302nd/ 347
METRIC RANK
98.3%
5TH GRADE
100.0/ 100
METRIC RATING
14th/ 347
METRIC RANK
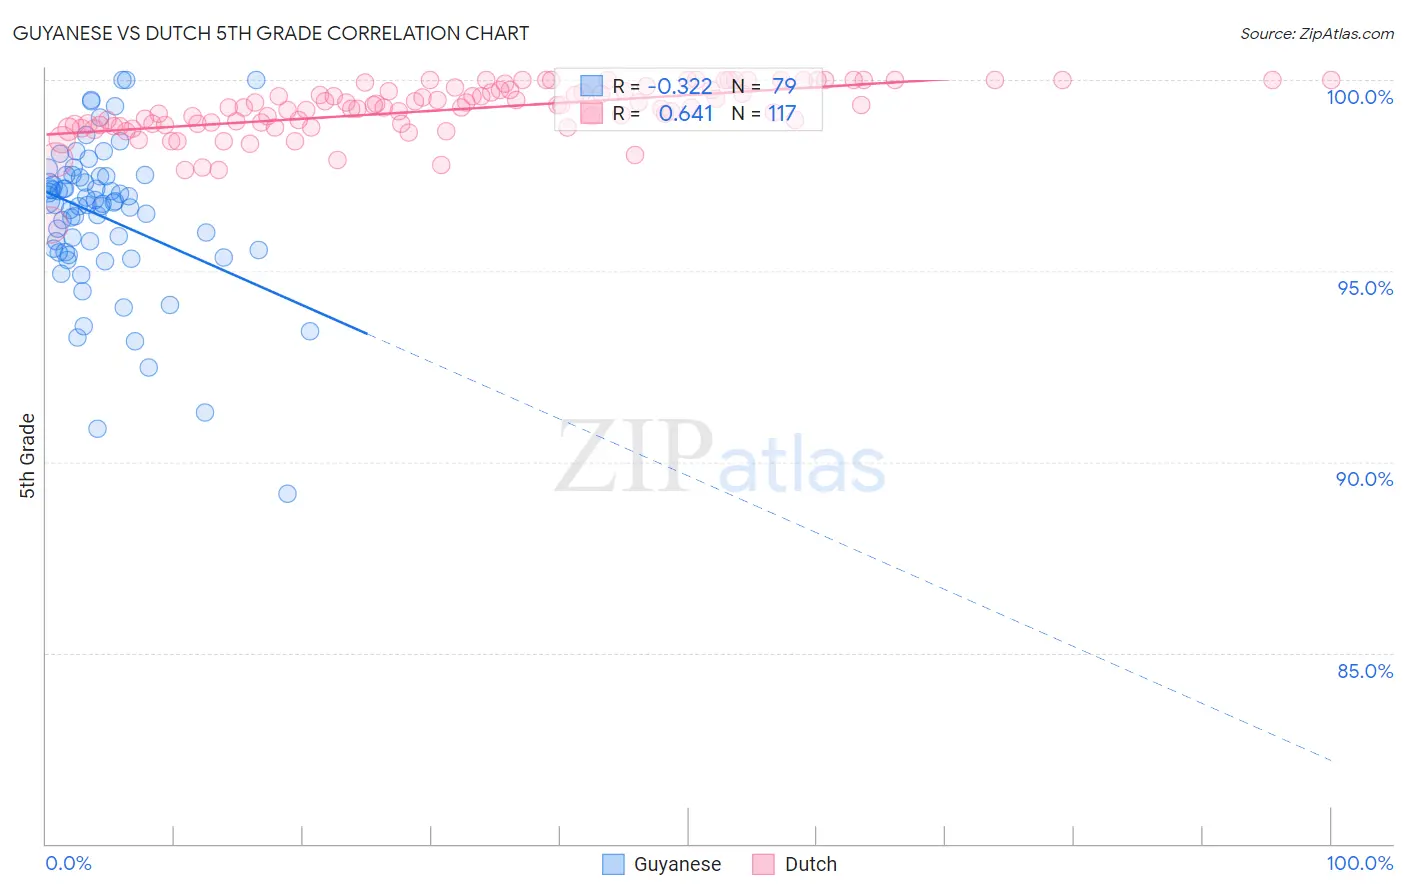
Guyanese vs Dutch 5th Grade Correlation Chart
The statistical analysis conducted on geographies consisting of 176,921,765 people shows a mild negative correlation between the proportion of Guyanese and percentage of population with at least 5th grade education in the United States with a correlation coefficient (R) of -0.322 and weighted average of 96.1%. Similarly, the statistical analysis conducted on geographies consisting of 554,359,260 people shows a significant positive correlation between the proportion of Dutch and percentage of population with at least 5th grade education in the United States with a correlation coefficient (R) of 0.641 and weighted average of 98.3%, a difference of 2.3%.
5th Grade Correlation Summary
| Measurement | Guyanese | Dutch |
| Minimum | 89.2% | 96.2% |
| Maximum | 100.0% | 100.0% |
| Range | 10.8% | 3.8% |
| Mean | 96.4% | 99.2% |
| Median | 96.8% | 99.3% |
| Interquartile 25% (IQ1) | 95.5% | 98.8% |
| Interquartile 75% (IQ3) | 97.5% | 99.7% |
| Interquartile Range (IQR) | 2.0% | 0.90% |
| Standard Deviation (Sample) | 2.0% | 0.67% |
| Standard Deviation (Population) | 2.0% | 0.67% |
Similar Demographics by 5th Grade
Demographics Similar to Guyanese by 5th Grade
In terms of 5th grade, the demographic groups most similar to Guyanese are Immigrants from Cuba (96.1%, a difference of 0.010%), Puerto Rican (96.1%, a difference of 0.010%), Sri Lankan (96.1%, a difference of 0.030%), Immigrants from Burma/Myanmar (96.1%, a difference of 0.040%), and Immigrants from Laos (96.0%, a difference of 0.050%).
| Demographics | Rating | Rank | 5th Grade |
| Immigrants | Somalia | 0.0 /100 | #295 | Tragic 96.4% |
| Immigrants | South Eastern Asia | 0.0 /100 | #296 | Tragic 96.3% |
| Haitians | 0.0 /100 | #297 | Tragic 96.3% |
| Immigrants | Dominica | 0.0 /100 | #298 | Tragic 96.2% |
| Immigrants | Immigrants | 0.0 /100 | #299 | Tragic 96.2% |
| Sri Lankans | 0.0 /100 | #300 | Tragic 96.1% |
| Immigrants | Cuba | 0.0 /100 | #301 | Tragic 96.1% |
| Guyanese | 0.0 /100 | #302 | Tragic 96.1% |
| Puerto Ricans | 0.0 /100 | #303 | Tragic 96.1% |
| Immigrants | Burma/Myanmar | 0.0 /100 | #304 | Tragic 96.1% |
| Immigrants | Laos | 0.0 /100 | #305 | Tragic 96.0% |
| Immigrants | Haiti | 0.0 /100 | #306 | Tragic 96.0% |
| Immigrants | Caribbean | 0.0 /100 | #307 | Tragic 96.0% |
| Ecuadorians | 0.0 /100 | #308 | Tragic 96.0% |
| Immigrants | Guyana | 0.0 /100 | #309 | Tragic 96.0% |
Demographics Similar to Dutch by 5th Grade
In terms of 5th grade, the demographic groups most similar to Dutch are Tlingit-Haida (98.3%, a difference of 0.010%), Scottish (98.3%, a difference of 0.010%), Polish (98.3%, a difference of 0.010%), Carpatho Rusyn (98.3%, a difference of 0.020%), and Irish (98.3%, a difference of 0.020%).
| Demographics | Rating | Rank | 5th Grade |
| Inupiat | 100.0 /100 | #7 | Exceptional 98.4% |
| Slovenes | 100.0 /100 | #8 | Exceptional 98.3% |
| Swedes | 100.0 /100 | #9 | Exceptional 98.3% |
| English | 100.0 /100 | #10 | Exceptional 98.3% |
| Alaskan Athabascans | 100.0 /100 | #11 | Exceptional 98.3% |
| Carpatho Rusyns | 100.0 /100 | #12 | Exceptional 98.3% |
| Tlingit-Haida | 100.0 /100 | #13 | Exceptional 98.3% |
| Dutch | 100.0 /100 | #14 | Exceptional 98.3% |
| Scottish | 100.0 /100 | #15 | Exceptional 98.3% |
| Poles | 100.0 /100 | #16 | Exceptional 98.3% |
| Irish | 100.0 /100 | #17 | Exceptional 98.3% |
| Pennsylvania Germans | 100.0 /100 | #18 | Exceptional 98.3% |
| Finns | 100.0 /100 | #19 | Exceptional 98.2% |
| Lithuanians | 100.0 /100 | #20 | Exceptional 98.2% |
| Danes | 100.0 /100 | #21 | Exceptional 98.2% |