Guyanese vs Immigrants from Cuba GED/Equivalency
COMPARE
Guyanese
Immigrants from Cuba
GED/Equivalency
GED/Equivalency Comparison
Guyanese
Immigrants from Cuba
81.3%
GED/EQUIVALENCY
0.0/ 100
METRIC RATING
306th/ 347
METRIC RANK
80.2%
GED/EQUIVALENCY
0.0/ 100
METRIC RATING
320th/ 347
METRIC RANK
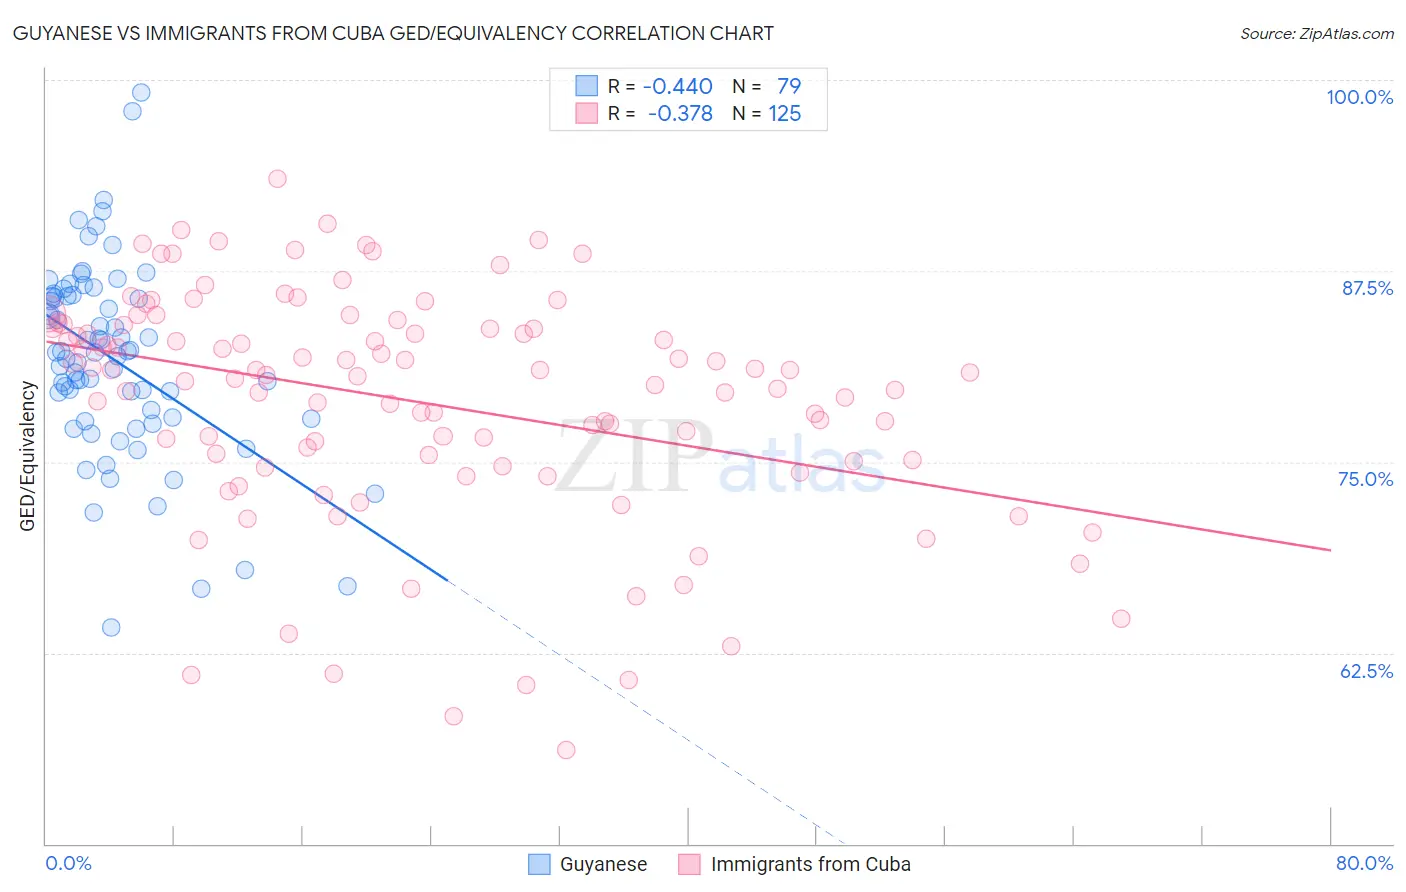
Guyanese vs Immigrants from Cuba GED/Equivalency Correlation Chart
The statistical analysis conducted on geographies consisting of 176,940,942 people shows a moderate negative correlation between the proportion of Guyanese and percentage of population with at least ged/equivalency education in the United States with a correlation coefficient (R) of -0.440 and weighted average of 81.3%. Similarly, the statistical analysis conducted on geographies consisting of 326,030,400 people shows a mild negative correlation between the proportion of Immigrants from Cuba and percentage of population with at least ged/equivalency education in the United States with a correlation coefficient (R) of -0.378 and weighted average of 80.2%, a difference of 1.4%.
GED/Equivalency Correlation Summary
| Measurement | Guyanese | Immigrants from Cuba |
| Minimum | 64.1% | 56.2% |
| Maximum | 99.2% | 93.5% |
| Range | 35.1% | 37.3% |
| Mean | 81.7% | 79.0% |
| Median | 82.2% | 80.7% |
| Interquartile 25% (IQ1) | 77.8% | 75.1% |
| Interquartile 75% (IQ3) | 85.9% | 83.9% |
| Interquartile Range (IQR) | 8.1% | 8.8% |
| Standard Deviation (Sample) | 6.4% | 7.5% |
| Standard Deviation (Population) | 6.3% | 7.5% |
Demographics Similar to Guyanese and Immigrants from Cuba by GED/Equivalency
In terms of ged/equivalency, the demographic groups most similar to Guyanese are Immigrants from Grenada (81.3%, a difference of 0.020%), Immigrants from Dominica (81.1%, a difference of 0.17%), Navajo (81.5%, a difference of 0.23%), Puerto Rican (81.1%, a difference of 0.28%), and Immigrants from Portugal (81.6%, a difference of 0.33%). Similarly, the demographic groups most similar to Immigrants from Cuba are Yup'ik (80.0%, a difference of 0.17%), Lumbee (80.0%, a difference of 0.24%), Immigrants from Nicaragua (79.9%, a difference of 0.36%), Yaqui (80.5%, a difference of 0.41%), and Immigrants from Belize (80.5%, a difference of 0.41%).
| Demographics | Rating | Rank | GED/Equivalency |
| Immigrants | Portugal | 0.0 /100 | #303 | Tragic 81.6% |
| Navajo | 0.0 /100 | #304 | Tragic 81.5% |
| Immigrants | Grenada | 0.0 /100 | #305 | Tragic 81.3% |
| Guyanese | 0.0 /100 | #306 | Tragic 81.3% |
| Immigrants | Dominica | 0.0 /100 | #307 | Tragic 81.1% |
| Puerto Ricans | 0.0 /100 | #308 | Tragic 81.1% |
| Immigrants | Ecuador | 0.0 /100 | #309 | Tragic 81.0% |
| Immigrants | Guyana | 0.0 /100 | #310 | Tragic 81.0% |
| Natives/Alaskans | 0.0 /100 | #311 | Tragic 80.9% |
| Nicaraguans | 0.0 /100 | #312 | Tragic 80.9% |
| Cape Verdeans | 0.0 /100 | #313 | Tragic 80.9% |
| Belizeans | 0.0 /100 | #314 | Tragic 80.9% |
| Apache | 0.0 /100 | #315 | Tragic 80.7% |
| Central American Indians | 0.0 /100 | #316 | Tragic 80.6% |
| Immigrants | Caribbean | 0.0 /100 | #317 | Tragic 80.5% |
| Yaqui | 0.0 /100 | #318 | Tragic 80.5% |
| Immigrants | Belize | 0.0 /100 | #319 | Tragic 80.5% |
| Immigrants | Cuba | 0.0 /100 | #320 | Tragic 80.2% |
| Yup'ik | 0.0 /100 | #321 | Tragic 80.0% |
| Lumbee | 0.0 /100 | #322 | Tragic 80.0% |
| Immigrants | Nicaragua | 0.0 /100 | #323 | Tragic 79.9% |