Haitian vs Burmese 6th Grade
COMPARE
Haitian
Burmese
6th Grade
6th Grade Comparison
Haitians
Burmese
95.8%
6TH GRADE
0.0/ 100
METRIC RATING
297th/ 347
METRIC RANK
97.3%
6TH GRADE
87.8/ 100
METRIC RATING
137th/ 347
METRIC RANK
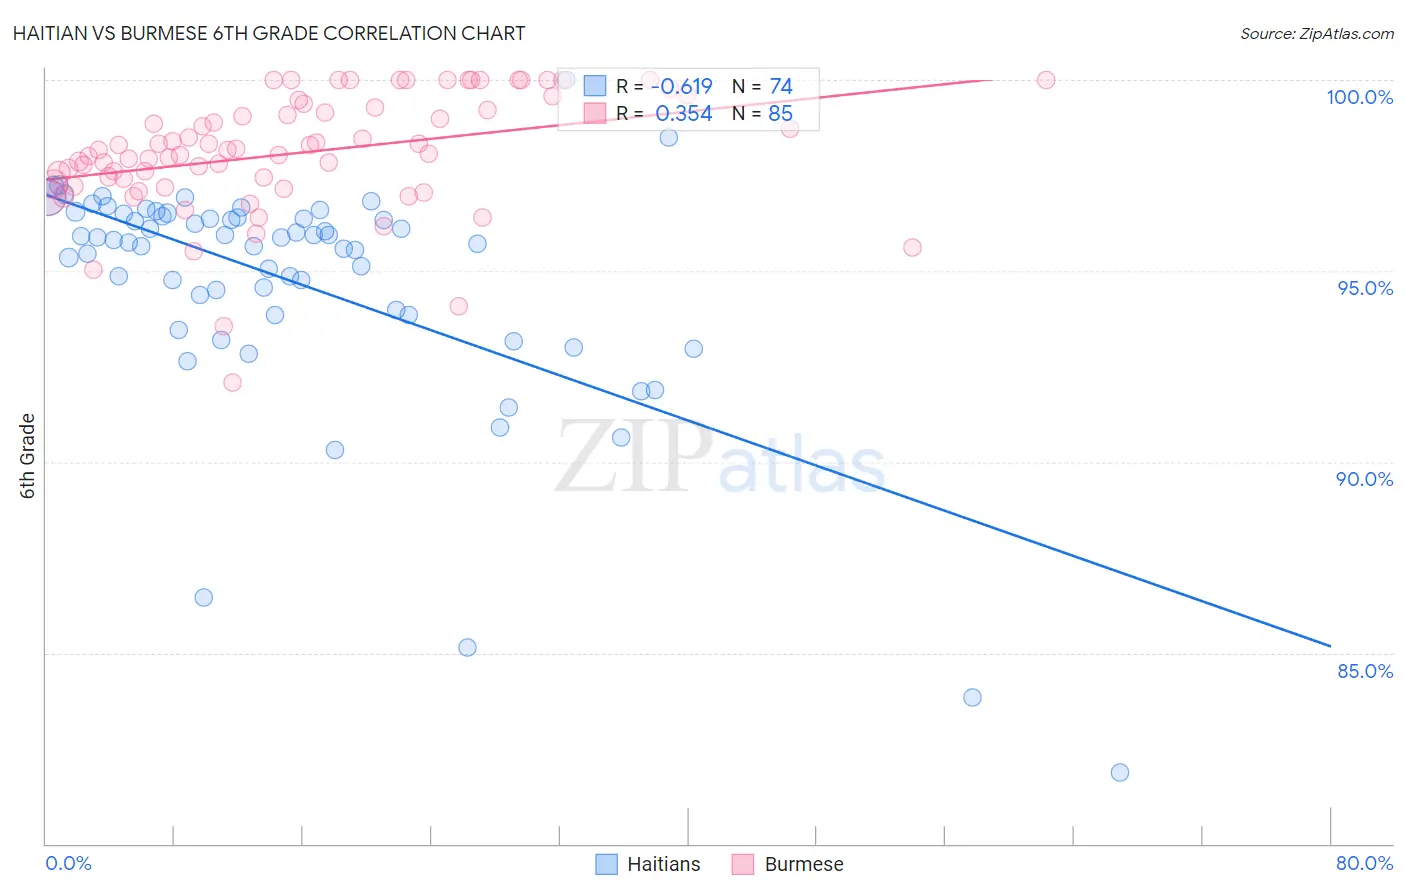
Haitian vs Burmese 6th Grade Correlation Chart
The statistical analysis conducted on geographies consisting of 288,018,742 people shows a significant negative correlation between the proportion of Haitians and percentage of population with at least 6th grade education in the United States with a correlation coefficient (R) of -0.619 and weighted average of 95.8%. Similarly, the statistical analysis conducted on geographies consisting of 465,275,994 people shows a mild positive correlation between the proportion of Burmese and percentage of population with at least 6th grade education in the United States with a correlation coefficient (R) of 0.354 and weighted average of 97.3%, a difference of 1.5%.
6th Grade Correlation Summary
| Measurement | Haitian | Burmese |
| Minimum | 81.9% | 92.1% |
| Maximum | 100.0% | 100.0% |
| Range | 18.1% | 7.9% |
| Mean | 94.7% | 98.1% |
| Median | 95.8% | 98.2% |
| Interquartile 25% (IQ1) | 93.8% | 97.2% |
| Interquartile 75% (IQ3) | 96.4% | 99.3% |
| Interquartile Range (IQR) | 2.6% | 2.1% |
| Standard Deviation (Sample) | 3.1% | 1.6% |
| Standard Deviation (Population) | 3.1% | 1.5% |
Similar Demographics by 6th Grade
Demographics Similar to Haitians by 6th Grade
In terms of 6th grade, the demographic groups most similar to Haitians are Sri Lankan (95.8%, a difference of 0.070%), Immigrants from Laos (95.7%, a difference of 0.080%), Immigrants from Dominica (95.7%, a difference of 0.090%), Immigrants (95.7%, a difference of 0.10%), and Immigrants from South Eastern Asia (95.9%, a difference of 0.11%).
| Demographics | Rating | Rank | 6th Grade |
| Immigrants | Somalia | 0.0 /100 | #290 | Tragic 96.1% |
| Immigrants | St. Vincent and the Grenadines | 0.0 /100 | #291 | Tragic 96.1% |
| Immigrants | Barbados | 0.0 /100 | #292 | Tragic 96.1% |
| Immigrants | West Indies | 0.0 /100 | #293 | Tragic 96.1% |
| British West Indians | 0.0 /100 | #294 | Tragic 96.0% |
| Immigrants | Grenada | 0.0 /100 | #295 | Tragic 95.9% |
| Immigrants | South Eastern Asia | 0.0 /100 | #296 | Tragic 95.9% |
| Haitians | 0.0 /100 | #297 | Tragic 95.8% |
| Sri Lankans | 0.0 /100 | #298 | Tragic 95.8% |
| Immigrants | Laos | 0.0 /100 | #299 | Tragic 95.7% |
| Immigrants | Dominica | 0.0 /100 | #300 | Tragic 95.7% |
| Immigrants | Immigrants | 0.0 /100 | #301 | Tragic 95.7% |
| Immigrants | Burma/Myanmar | 0.0 /100 | #302 | Tragic 95.7% |
| Bangladeshis | 0.0 /100 | #303 | Tragic 95.7% |
| Indonesians | 0.0 /100 | #304 | Tragic 95.6% |
Demographics Similar to Burmese by 6th Grade
In terms of 6th grade, the demographic groups most similar to Burmese are Blackfeet (97.3%, a difference of 0.0%), Filipino (97.3%, a difference of 0.010%), Immigrants from Kuwait (97.3%, a difference of 0.020%), Immigrants from Hungary (97.3%, a difference of 0.020%), and Immigrants from Turkey (97.3%, a difference of 0.020%).
| Demographics | Rating | Rank | 6th Grade |
| Cambodians | 91.8 /100 | #130 | Exceptional 97.3% |
| Immigrants | Europe | 91.1 /100 | #131 | Exceptional 97.3% |
| Palestinians | 90.9 /100 | #132 | Exceptional 97.3% |
| Immigrants | Moldova | 90.0 /100 | #133 | Excellent 97.3% |
| Immigrants | Kuwait | 89.5 /100 | #134 | Excellent 97.3% |
| Immigrants | Hungary | 89.5 /100 | #135 | Excellent 97.3% |
| Filipinos | 88.9 /100 | #136 | Excellent 97.3% |
| Burmese | 87.8 /100 | #137 | Excellent 97.3% |
| Blackfeet | 87.7 /100 | #138 | Excellent 97.3% |
| Immigrants | Turkey | 86.1 /100 | #139 | Excellent 97.3% |
| Immigrants | North Macedonia | 85.5 /100 | #140 | Excellent 97.2% |
| Seminole | 84.8 /100 | #141 | Excellent 97.2% |
| Jordanians | 84.6 /100 | #142 | Excellent 97.2% |
| Pima | 82.9 /100 | #143 | Excellent 97.2% |
| Israelis | 82.9 /100 | #144 | Excellent 97.2% |