Hungarian vs Maltese 12th Grade, No Diploma
COMPARE
Hungarian
Maltese
12th Grade, No Diploma
12th Grade, No Diploma Comparison
Hungarians
Maltese
92.8%
12TH GRADE, NO DIPLOMA
99.7/ 100
METRIC RATING
54th/ 347
METRIC RANK
93.3%
12TH GRADE, NO DIPLOMA
100.0/ 100
METRIC RATING
16th/ 347
METRIC RANK
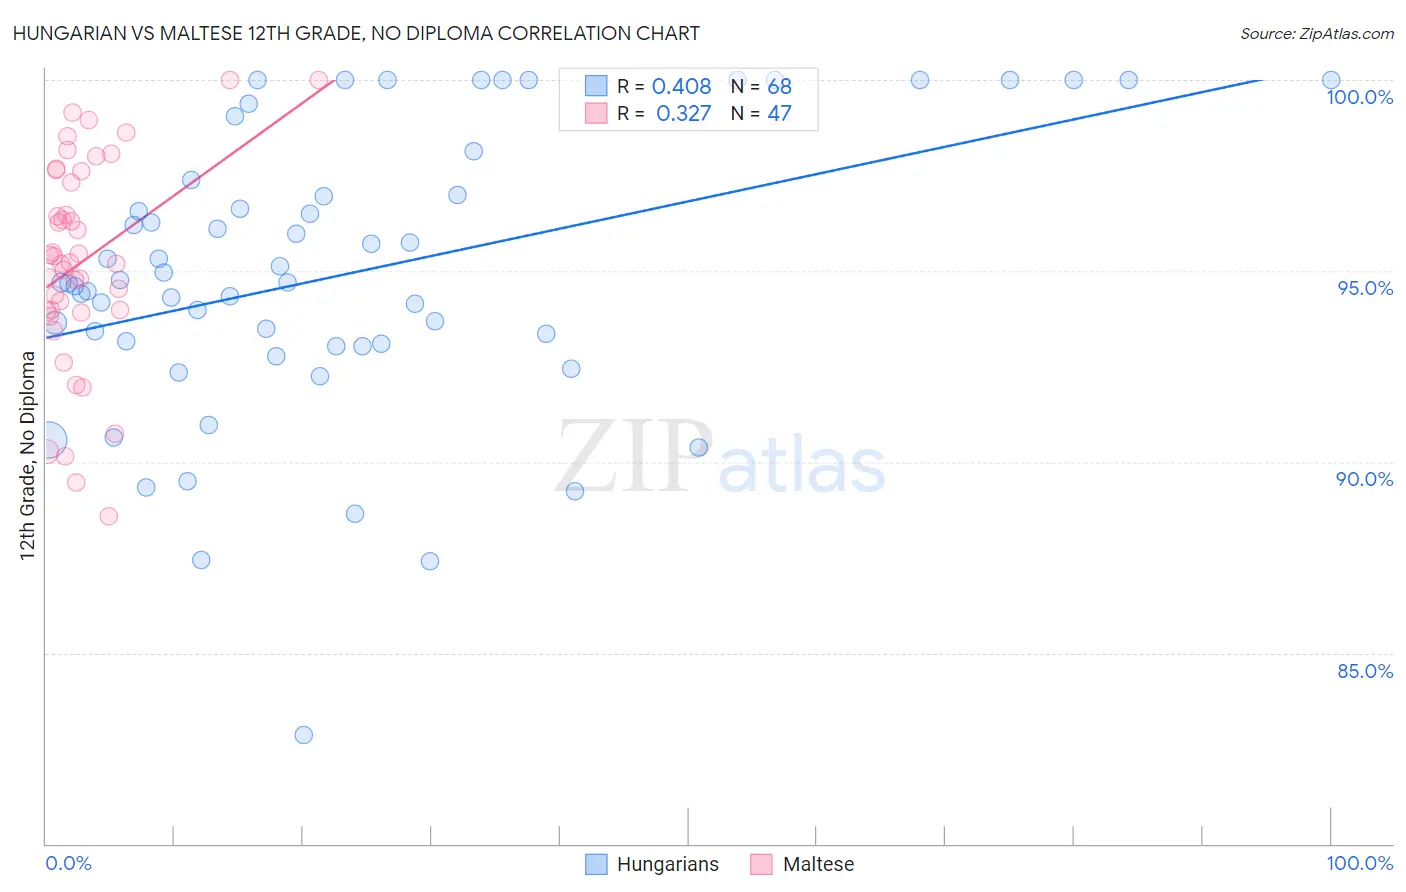
Hungarian vs Maltese 12th Grade, No Diploma Correlation Chart
The statistical analysis conducted on geographies consisting of 486,240,766 people shows a moderate positive correlation between the proportion of Hungarians and percentage of population with at least 12th grade (no diploma) education in the United States with a correlation coefficient (R) of 0.408 and weighted average of 92.8%. Similarly, the statistical analysis conducted on geographies consisting of 126,478,003 people shows a mild positive correlation between the proportion of Maltese and percentage of population with at least 12th grade (no diploma) education in the United States with a correlation coefficient (R) of 0.327 and weighted average of 93.3%, a difference of 0.53%.
12th Grade, No Diploma Correlation Summary
| Measurement | Hungarian | Maltese |
| Minimum | 82.9% | 88.6% |
| Maximum | 100.0% | 100.0% |
| Range | 17.1% | 11.4% |
| Mean | 94.9% | 95.2% |
| Median | 94.7% | 95.2% |
| Interquartile 25% (IQ1) | 93.1% | 93.9% |
| Interquartile 75% (IQ3) | 97.2% | 97.6% |
| Interquartile Range (IQR) | 4.1% | 3.7% |
| Standard Deviation (Sample) | 3.7% | 2.7% |
| Standard Deviation (Population) | 3.7% | 2.7% |
Similar Demographics by 12th Grade, No Diploma
Demographics Similar to Hungarians by 12th Grade, No Diploma
In terms of 12th grade, no diploma, the demographic groups most similar to Hungarians are Serbian (92.8%, a difference of 0.0%), Welsh (92.8%, a difference of 0.0%), Immigrants from Sweden (92.8%, a difference of 0.010%), New Zealander (92.8%, a difference of 0.010%), and Tsimshian (92.9%, a difference of 0.030%).
| Demographics | Rating | Rank | 12th Grade, No Diploma |
| Belgians | 99.8 /100 | #47 | Exceptional 92.9% |
| Australians | 99.8 /100 | #48 | Exceptional 92.9% |
| Macedonians | 99.8 /100 | #49 | Exceptional 92.9% |
| Tsimshian | 99.8 /100 | #50 | Exceptional 92.9% |
| Immigrants | Belgium | 99.8 /100 | #51 | Exceptional 92.9% |
| Immigrants | Sweden | 99.8 /100 | #52 | Exceptional 92.8% |
| Serbians | 99.7 /100 | #53 | Exceptional 92.8% |
| Hungarians | 99.7 /100 | #54 | Exceptional 92.8% |
| Welsh | 99.7 /100 | #55 | Exceptional 92.8% |
| New Zealanders | 99.7 /100 | #56 | Exceptional 92.8% |
| Immigrants | Canada | 99.7 /100 | #57 | Exceptional 92.8% |
| Immigrants | Taiwan | 99.7 /100 | #58 | Exceptional 92.8% |
| Immigrants | North America | 99.7 /100 | #59 | Exceptional 92.8% |
| Slavs | 99.7 /100 | #60 | Exceptional 92.8% |
| Immigrants | Japan | 99.7 /100 | #61 | Exceptional 92.8% |
Demographics Similar to Maltese by 12th Grade, No Diploma
In terms of 12th grade, no diploma, the demographic groups most similar to Maltese are Luxembourger (93.3%, a difference of 0.020%), Finnish (93.4%, a difference of 0.040%), Immigrants from Singapore (93.3%, a difference of 0.050%), German (93.3%, a difference of 0.070%), and Filipino (93.2%, a difference of 0.10%).
| Demographics | Rating | Rank | 12th Grade, No Diploma |
| Latvians | 100.0 /100 | #9 | Exceptional 93.6% |
| Croatians | 100.0 /100 | #10 | Exceptional 93.5% |
| Poles | 100.0 /100 | #11 | Exceptional 93.5% |
| Eastern Europeans | 100.0 /100 | #12 | Exceptional 93.5% |
| Danes | 100.0 /100 | #13 | Exceptional 93.5% |
| Bulgarians | 100.0 /100 | #14 | Exceptional 93.5% |
| Finns | 100.0 /100 | #15 | Exceptional 93.4% |
| Maltese | 100.0 /100 | #16 | Exceptional 93.3% |
| Luxembourgers | 100.0 /100 | #17 | Exceptional 93.3% |
| Immigrants | Singapore | 99.9 /100 | #18 | Exceptional 93.3% |
| Germans | 99.9 /100 | #19 | Exceptional 93.3% |
| Filipinos | 99.9 /100 | #20 | Exceptional 93.2% |
| Italians | 99.9 /100 | #21 | Exceptional 93.2% |
| Estonians | 99.9 /100 | #22 | Exceptional 93.2% |
| Scandinavians | 99.9 /100 | #23 | Exceptional 93.2% |