Immigrants from Africa vs Basque 11th Grade
COMPARE
Immigrants from Africa
Basque
11th Grade
11th Grade Comparison
Immigrants from Africa
Basques
91.9%
11TH GRADE
6.5/ 100
METRIC RATING
222nd/ 347
METRIC RANK
93.2%
11TH GRADE
95.2/ 100
METRIC RATING
126th/ 347
METRIC RANK
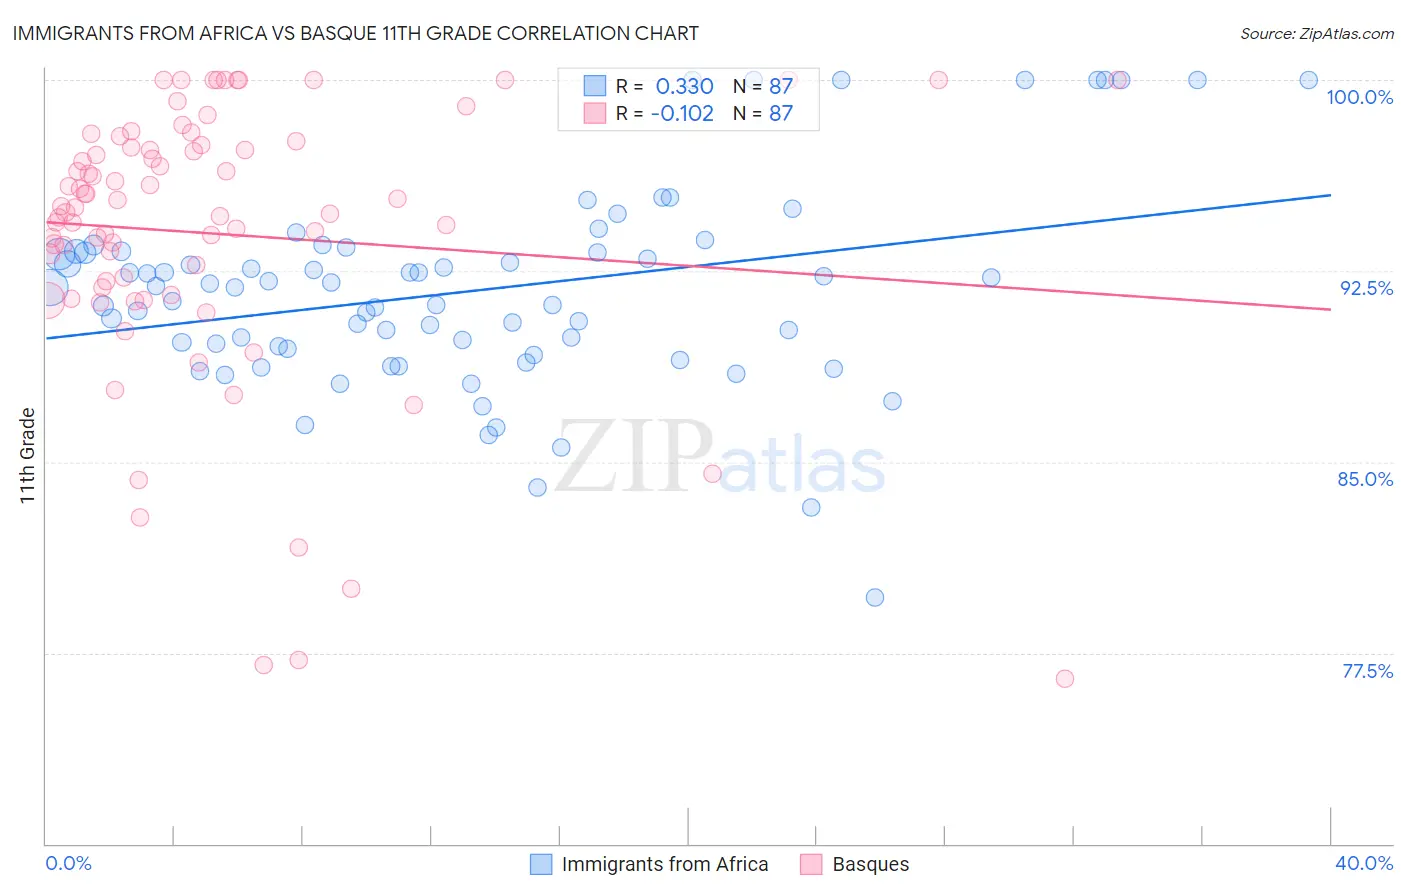
Immigrants from Africa vs Basque 11th Grade Correlation Chart
The statistical analysis conducted on geographies consisting of 469,408,484 people shows a mild positive correlation between the proportion of Immigrants from Africa and percentage of population with at least 11th grade education in the United States with a correlation coefficient (R) of 0.330 and weighted average of 91.9%. Similarly, the statistical analysis conducted on geographies consisting of 165,777,136 people shows a poor negative correlation between the proportion of Basques and percentage of population with at least 11th grade education in the United States with a correlation coefficient (R) of -0.102 and weighted average of 93.2%, a difference of 1.4%.
11th Grade Correlation Summary
| Measurement | Immigrants from Africa | Basque |
| Minimum | 79.7% | 76.5% |
| Maximum | 100.0% | 100.0% |
| Range | 20.3% | 23.5% |
| Mean | 91.7% | 94.0% |
| Median | 91.9% | 95.0% |
| Interquartile 25% (IQ1) | 89.4% | 91.9% |
| Interquartile 75% (IQ3) | 93.3% | 97.5% |
| Interquartile Range (IQR) | 3.8% | 5.6% |
| Standard Deviation (Sample) | 3.9% | 5.4% |
| Standard Deviation (Population) | 3.9% | 5.4% |
Similar Demographics by 11th Grade
Demographics Similar to Immigrants from Africa by 11th Grade
In terms of 11th grade, the demographic groups most similar to Immigrants from Africa are Immigrants from Bahamas (91.9%, a difference of 0.0%), Costa Rican (91.9%, a difference of 0.010%), Immigrants from Liberia (91.9%, a difference of 0.020%), South American Indian (92.0%, a difference of 0.040%), and Immigrants from Zaire (91.9%, a difference of 0.050%).
| Demographics | Rating | Rank | 11th Grade |
| Immigrants | Southern Europe | 12.5 /100 | #215 | Poor 92.1% |
| Somalis | 11.6 /100 | #216 | Poor 92.1% |
| Immigrants | Sierra Leone | 11.1 /100 | #217 | Poor 92.0% |
| Blackfeet | 10.1 /100 | #218 | Poor 92.0% |
| Portuguese | 10.0 /100 | #219 | Tragic 92.0% |
| South American Indians | 7.6 /100 | #220 | Tragic 92.0% |
| Immigrants | Liberia | 7.0 /100 | #221 | Tragic 91.9% |
| Immigrants | Africa | 6.5 /100 | #222 | Tragic 91.9% |
| Immigrants | Bahamas | 6.5 /100 | #223 | Tragic 91.9% |
| Costa Ricans | 6.3 /100 | #224 | Tragic 91.9% |
| Immigrants | Zaire | 5.4 /100 | #225 | Tragic 91.9% |
| Immigrants | Somalia | 5.2 /100 | #226 | Tragic 91.9% |
| Immigrants | Cameroon | 4.4 /100 | #227 | Tragic 91.8% |
| Immigrants | Panama | 4.3 /100 | #228 | Tragic 91.8% |
| Nigerians | 4.3 /100 | #229 | Tragic 91.8% |
Demographics Similar to Basques by 11th Grade
In terms of 11th grade, the demographic groups most similar to Basques are Immigrants from Sri Lanka (93.2%, a difference of 0.020%), Immigrants from Greece (93.2%, a difference of 0.040%), Immigrants from Eastern Europe (93.2%, a difference of 0.040%), German Russian (93.3%, a difference of 0.070%), and Immigrants from Belarus (93.3%, a difference of 0.070%).
| Demographics | Rating | Rank | 11th Grade |
| Israelis | 97.0 /100 | #119 | Exceptional 93.3% |
| Immigrants | Russia | 96.6 /100 | #120 | Exceptional 93.3% |
| German Russians | 96.4 /100 | #121 | Exceptional 93.3% |
| Immigrants | Belarus | 96.3 /100 | #122 | Exceptional 93.3% |
| Immigrants | Greece | 95.9 /100 | #123 | Exceptional 93.2% |
| Immigrants | Eastern Europe | 95.9 /100 | #124 | Exceptional 93.2% |
| Immigrants | Sri Lanka | 95.6 /100 | #125 | Exceptional 93.2% |
| Basques | 95.2 /100 | #126 | Exceptional 93.2% |
| Immigrants | Kazakhstan | 92.4 /100 | #127 | Exceptional 93.1% |
| Immigrants | Jordan | 92.4 /100 | #128 | Exceptional 93.1% |
| Immigrants | Ukraine | 89.8 /100 | #129 | Excellent 93.0% |
| Albanians | 89.5 /100 | #130 | Excellent 93.0% |
| Egyptians | 89.5 /100 | #131 | Excellent 93.0% |
| Immigrants | Bosnia and Herzegovina | 89.0 /100 | #132 | Excellent 93.0% |
| Mongolians | 87.6 /100 | #133 | Excellent 93.0% |