Immigrants from Belarus vs Immigrants from Honduras 3rd Grade
COMPARE
Immigrants from Belarus
Immigrants from Honduras
3rd Grade
3rd Grade Comparison
Immigrants from Belarus
Immigrants from Honduras
97.7%
3RD GRADE
45.9/ 100
METRIC RATING
179th/ 347
METRIC RANK
96.3%
3RD GRADE
0.0/ 100
METRIC RATING
329th/ 347
METRIC RANK
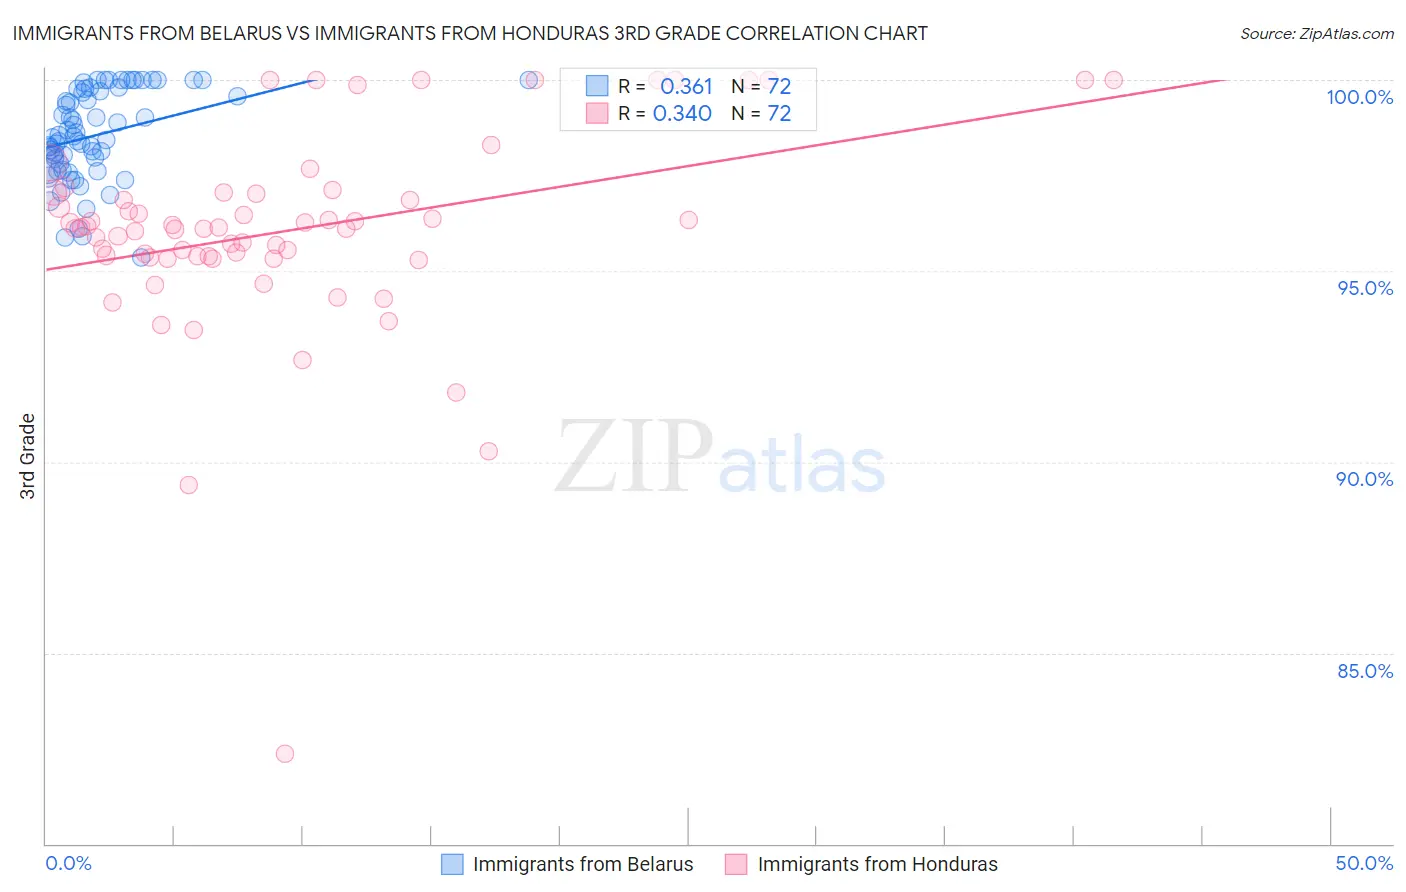
Immigrants from Belarus vs Immigrants from Honduras 3rd Grade Correlation Chart
The statistical analysis conducted on geographies consisting of 149,993,317 people shows a mild positive correlation between the proportion of Immigrants from Belarus and percentage of population with at least 3rd grade education in the United States with a correlation coefficient (R) of 0.361 and weighted average of 97.7%. Similarly, the statistical analysis conducted on geographies consisting of 322,637,445 people shows a mild positive correlation between the proportion of Immigrants from Honduras and percentage of population with at least 3rd grade education in the United States with a correlation coefficient (R) of 0.340 and weighted average of 96.3%, a difference of 1.5%.
3rd Grade Correlation Summary
| Measurement | Immigrants from Belarus | Immigrants from Honduras |
| Minimum | 95.4% | 82.3% |
| Maximum | 100.0% | 100.0% |
| Range | 4.6% | 17.7% |
| Mean | 98.6% | 96.1% |
| Median | 98.5% | 96.1% |
| Interquartile 25% (IQ1) | 97.7% | 95.4% |
| Interquartile 75% (IQ3) | 99.7% | 97.0% |
| Interquartile Range (IQR) | 2.0% | 1.6% |
| Standard Deviation (Sample) | 1.2% | 2.7% |
| Standard Deviation (Population) | 1.2% | 2.7% |
Similar Demographics by 3rd Grade
Demographics Similar to Immigrants from Belarus by 3rd Grade
In terms of 3rd grade, the demographic groups most similar to Immigrants from Belarus are Immigrants from Poland (97.8%, a difference of 0.0%), Egyptian (97.7%, a difference of 0.0%), Immigrants from Brazil (97.7%, a difference of 0.0%), Immigrants from Sri Lanka (97.7%, a difference of 0.0%), and Navajo (97.8%, a difference of 0.010%).
| Demographics | Rating | Rank | 3rd Grade |
| Spanish Americans | 51.8 /100 | #172 | Average 97.8% |
| Immigrants | Korea | 50.9 /100 | #173 | Average 97.8% |
| Navajo | 50.0 /100 | #174 | Average 97.8% |
| Immigrants | Micronesia | 47.6 /100 | #175 | Average 97.8% |
| Immigrants | Poland | 47.1 /100 | #176 | Average 97.8% |
| Egyptians | 46.6 /100 | #177 | Average 97.7% |
| Immigrants | Brazil | 46.4 /100 | #178 | Average 97.7% |
| Immigrants | Belarus | 45.9 /100 | #179 | Average 97.7% |
| Immigrants | Sri Lanka | 45.1 /100 | #180 | Average 97.7% |
| Immigrants | Venezuela | 44.4 /100 | #181 | Average 97.7% |
| Argentineans | 42.9 /100 | #182 | Average 97.7% |
| Arabs | 40.0 /100 | #183 | Fair 97.7% |
| Immigrants | Kazakhstan | 37.4 /100 | #184 | Fair 97.7% |
| Immigrants | Argentina | 37.0 /100 | #185 | Fair 97.7% |
| Portuguese | 36.2 /100 | #186 | Fair 97.7% |
Demographics Similar to Immigrants from Honduras by 3rd Grade
In terms of 3rd grade, the demographic groups most similar to Immigrants from Honduras are Japanese (96.4%, a difference of 0.020%), Bangladeshi (96.3%, a difference of 0.020%), Immigrants from Vietnam (96.4%, a difference of 0.030%), Mexican American Indian (96.4%, a difference of 0.070%), and Dominican (96.4%, a difference of 0.080%).
| Demographics | Rating | Rank | 3rd Grade |
| Immigrants | Belize | 0.0 /100 | #322 | Tragic 96.5% |
| Hondurans | 0.0 /100 | #323 | Tragic 96.5% |
| Dominicans | 0.0 /100 | #324 | Tragic 96.4% |
| Mexican American Indians | 0.0 /100 | #325 | Tragic 96.4% |
| Immigrants | Vietnam | 0.0 /100 | #326 | Tragic 96.4% |
| Japanese | 0.0 /100 | #327 | Tragic 96.4% |
| Bangladeshis | 0.0 /100 | #328 | Tragic 96.3% |
| Immigrants | Honduras | 0.0 /100 | #329 | Tragic 96.3% |
| Immigrants | Armenia | 0.0 /100 | #330 | Tragic 96.3% |
| Immigrants | Latin America | 0.0 /100 | #331 | Tragic 96.2% |
| Mexicans | 0.0 /100 | #332 | Tragic 96.2% |
| Immigrants | Fiji | 0.0 /100 | #333 | Tragic 96.2% |
| Immigrants | Cambodia | 0.0 /100 | #334 | Tragic 96.2% |
| Immigrants | Dominican Republic | 0.0 /100 | #335 | Tragic 96.2% |
| Immigrants | Cabo Verde | 0.0 /100 | #336 | Tragic 96.2% |