Immigrants from Cambodia vs Spaniard High School Diploma
COMPARE
Immigrants from Cambodia
Spaniard
High School Diploma
High School Diploma Comparison
Immigrants from Cambodia
Spaniards
85.6%
HIGH SCHOOL DIPLOMA
0.0/ 100
METRIC RATING
296th/ 347
METRIC RANK
89.1%
HIGH SCHOOL DIPLOMA
43.4/ 100
METRIC RATING
182nd/ 347
METRIC RANK
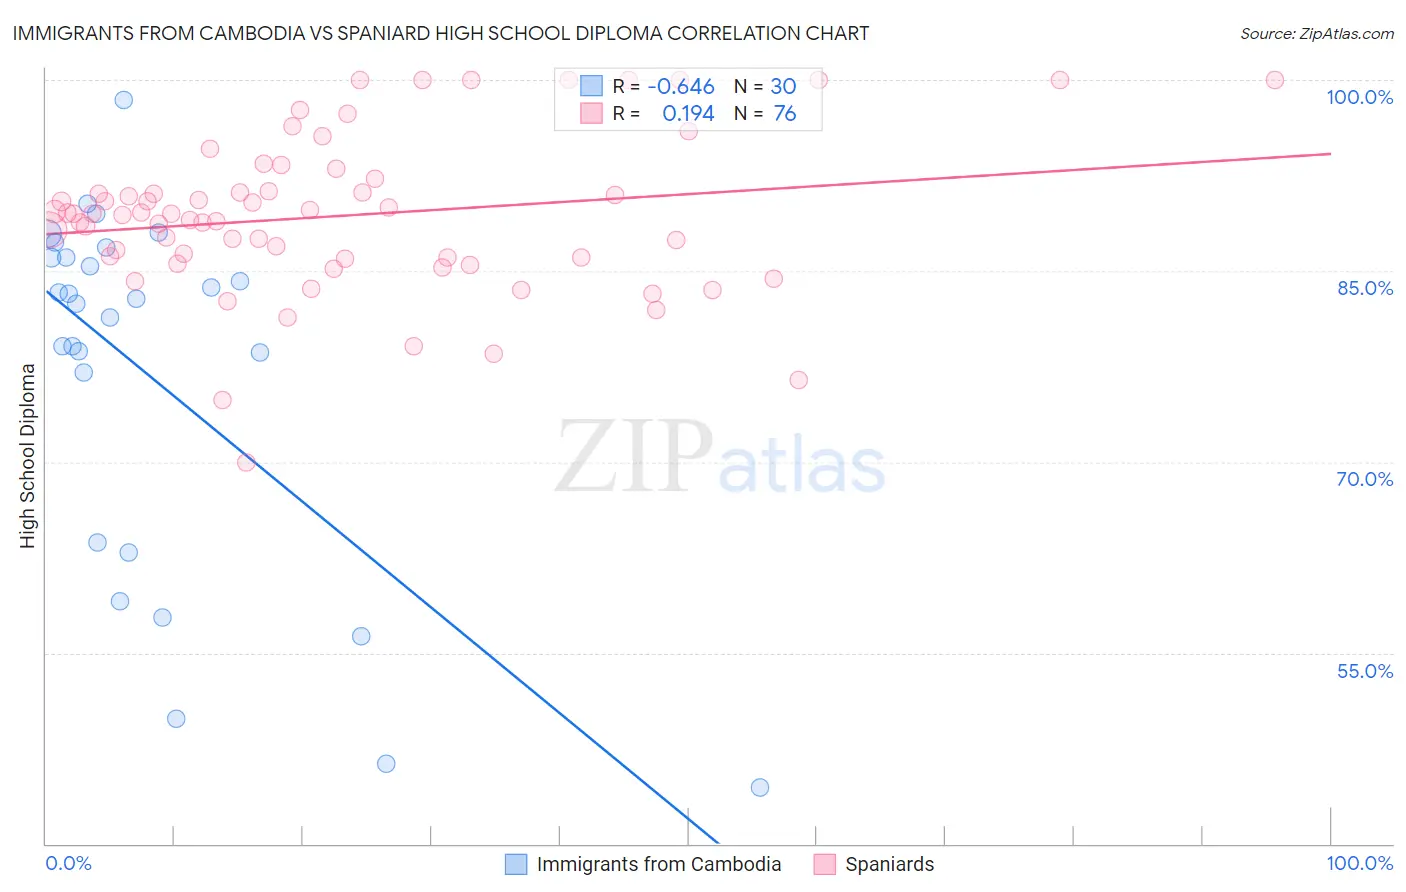
Immigrants from Cambodia vs Spaniard High School Diploma Correlation Chart
The statistical analysis conducted on geographies consisting of 205,153,442 people shows a significant negative correlation between the proportion of Immigrants from Cambodia and percentage of population with at least high school diploma education in the United States with a correlation coefficient (R) of -0.646 and weighted average of 85.6%. Similarly, the statistical analysis conducted on geographies consisting of 443,545,794 people shows a poor positive correlation between the proportion of Spaniards and percentage of population with at least high school diploma education in the United States with a correlation coefficient (R) of 0.194 and weighted average of 89.1%, a difference of 4.0%.
High School Diploma Correlation Summary
| Measurement | Immigrants from Cambodia | Spaniard |
| Minimum | 44.4% | 69.9% |
| Maximum | 98.4% | 100.0% |
| Range | 54.0% | 30.1% |
| Mean | 76.7% | 89.3% |
| Median | 82.6% | 89.5% |
| Interquartile 25% (IQ1) | 63.7% | 86.0% |
| Interquartile 75% (IQ3) | 86.1% | 91.7% |
| Interquartile Range (IQR) | 22.4% | 5.7% |
| Standard Deviation (Sample) | 14.4% | 6.2% |
| Standard Deviation (Population) | 14.1% | 6.1% |
Similar Demographics by High School Diploma
Demographics Similar to Immigrants from Cambodia by High School Diploma
In terms of high school diploma, the demographic groups most similar to Immigrants from Cambodia are Immigrants from Grenada (85.6%, a difference of 0.070%), Native/Alaskan (85.6%, a difference of 0.090%), Guyanese (85.5%, a difference of 0.18%), Immigrants (85.8%, a difference of 0.21%), and Immigrants from Bangladesh (85.5%, a difference of 0.21%).
| Demographics | Rating | Rank | High School Diploma |
| Yup'ik | 0.0 /100 | #289 | Tragic 86.1% |
| Fijians | 0.0 /100 | #290 | Tragic 86.0% |
| Haitians | 0.0 /100 | #291 | Tragic 85.9% |
| Japanese | 0.0 /100 | #292 | Tragic 85.9% |
| British West Indians | 0.0 /100 | #293 | Tragic 85.9% |
| Immigrants | Fiji | 0.0 /100 | #294 | Tragic 85.8% |
| Immigrants | Immigrants | 0.0 /100 | #295 | Tragic 85.8% |
| Immigrants | Cambodia | 0.0 /100 | #296 | Tragic 85.6% |
| Immigrants | Grenada | 0.0 /100 | #297 | Tragic 85.6% |
| Natives/Alaskans | 0.0 /100 | #298 | Tragic 85.6% |
| Guyanese | 0.0 /100 | #299 | Tragic 85.5% |
| Immigrants | Bangladesh | 0.0 /100 | #300 | Tragic 85.5% |
| Vietnamese | 0.0 /100 | #301 | Tragic 85.4% |
| Immigrants | Haiti | 0.0 /100 | #302 | Tragic 85.4% |
| Cubans | 0.0 /100 | #303 | Tragic 85.4% |
Demographics Similar to Spaniards by High School Diploma
In terms of high school diploma, the demographic groups most similar to Spaniards are Venezuelan (89.1%, a difference of 0.0%), Potawatomi (89.0%, a difference of 0.010%), Bolivian (89.1%, a difference of 0.030%), American (89.1%, a difference of 0.060%), and Immigrants from Syria (89.0%, a difference of 0.060%).
| Demographics | Rating | Rank | High School Diploma |
| Immigrants | Western Asia | 49.0 /100 | #175 | Average 89.1% |
| Osage | 48.9 /100 | #176 | Average 89.1% |
| Sudanese | 48.5 /100 | #177 | Average 89.1% |
| Sierra Leoneans | 48.4 /100 | #178 | Average 89.1% |
| Americans | 47.2 /100 | #179 | Average 89.1% |
| Bolivians | 45.2 /100 | #180 | Average 89.1% |
| Venezuelans | 43.6 /100 | #181 | Average 89.1% |
| Spaniards | 43.4 /100 | #182 | Average 89.1% |
| Potawatomi | 42.5 /100 | #183 | Average 89.0% |
| Immigrants | Syria | 39.2 /100 | #184 | Fair 89.0% |
| Ethiopians | 37.0 /100 | #185 | Fair 89.0% |
| Immigrants | Eastern Africa | 35.8 /100 | #186 | Fair 88.9% |
| Guamanians/Chamorros | 35.5 /100 | #187 | Fair 88.9% |
| Immigrants | Sudan | 33.4 /100 | #188 | Fair 88.9% |
| Immigrants | Uganda | 32.6 /100 | #189 | Fair 88.9% |