Immigrants from Caribbean vs Samoan High School Diploma
COMPARE
Immigrants from Caribbean
Samoan
High School Diploma
High School Diploma Comparison
Immigrants from Caribbean
Samoans
84.3%
HIGH SCHOOL DIPLOMA
0.0/ 100
METRIC RATING
317th/ 347
METRIC RANK
88.5%
HIGH SCHOOL DIPLOMA
14.0/ 100
METRIC RATING
210th/ 347
METRIC RANK
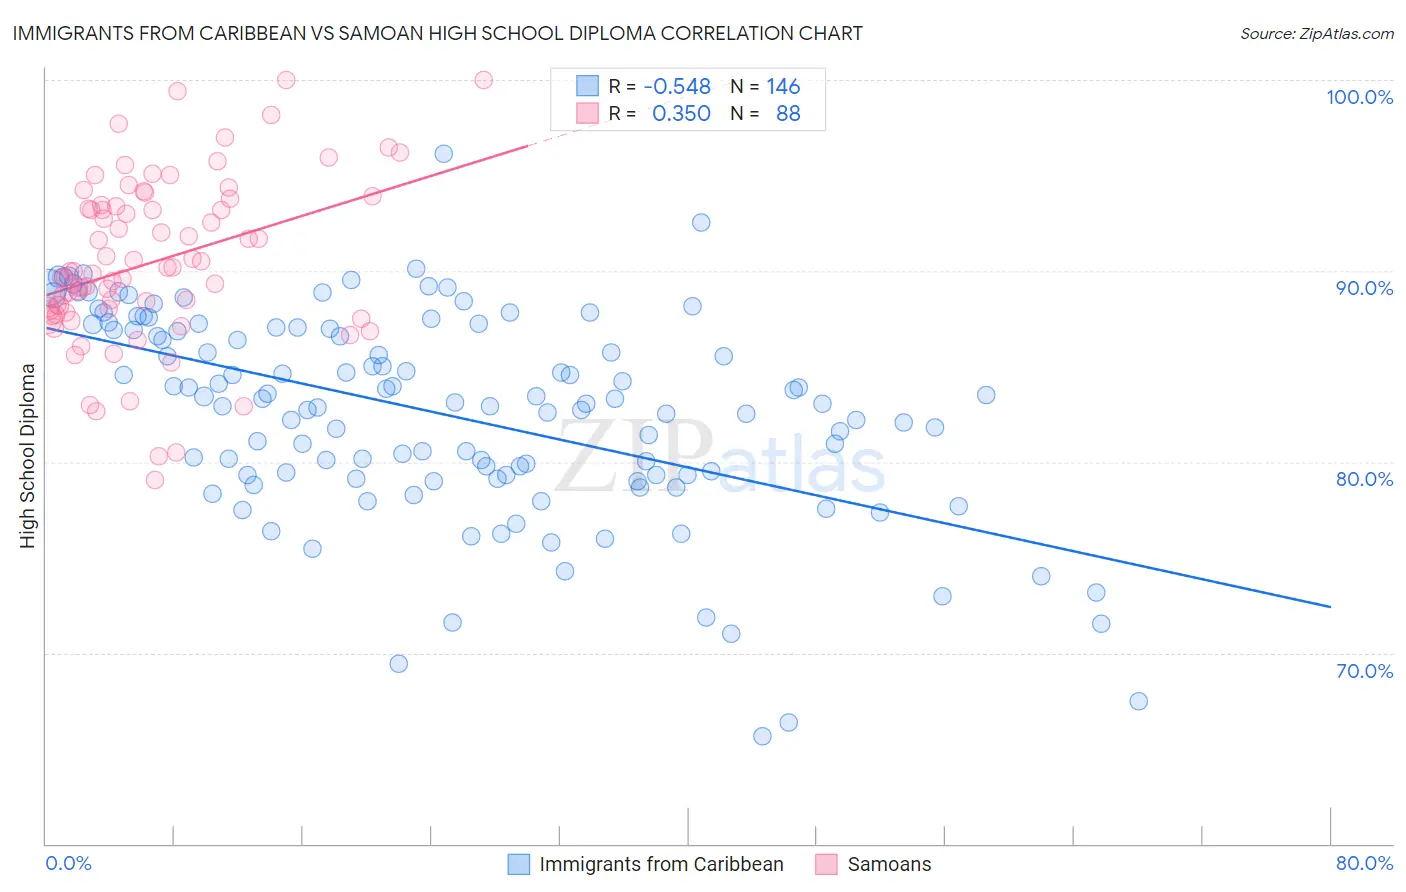
Immigrants from Caribbean vs Samoan High School Diploma Correlation Chart
The statistical analysis conducted on geographies consisting of 450,064,503 people shows a substantial negative correlation between the proportion of Immigrants from Caribbean and percentage of population with at least high school diploma education in the United States with a correlation coefficient (R) of -0.548 and weighted average of 84.3%. Similarly, the statistical analysis conducted on geographies consisting of 225,205,998 people shows a mild positive correlation between the proportion of Samoans and percentage of population with at least high school diploma education in the United States with a correlation coefficient (R) of 0.350 and weighted average of 88.5%, a difference of 5.1%.
High School Diploma Correlation Summary
| Measurement | Immigrants from Caribbean | Samoan |
| Minimum | 65.6% | 79.0% |
| Maximum | 96.2% | 100.0% |
| Range | 30.5% | 21.0% |
| Mean | 82.5% | 90.5% |
| Median | 83.1% | 90.0% |
| Interquartile 25% (IQ1) | 79.3% | 87.9% |
| Interquartile 75% (IQ3) | 87.0% | 93.4% |
| Interquartile Range (IQR) | 7.7% | 5.5% |
| Standard Deviation (Sample) | 5.4% | 4.3% |
| Standard Deviation (Population) | 5.4% | 4.3% |
Similar Demographics by High School Diploma
Demographics Similar to Immigrants from Caribbean by High School Diploma
In terms of high school diploma, the demographic groups most similar to Immigrants from Caribbean are Belizean (84.3%, a difference of 0.060%), Immigrants from Belize (84.2%, a difference of 0.070%), Central American Indian (84.2%, a difference of 0.11%), Nicaraguan (84.1%, a difference of 0.21%), and Yuman (84.0%, a difference of 0.34%).
| Demographics | Rating | Rank | High School Diploma |
| Apache | 0.0 /100 | #310 | Tragic 85.1% |
| Ecuadorians | 0.0 /100 | #311 | Tragic 85.1% |
| Cape Verdeans | 0.0 /100 | #312 | Tragic 85.1% |
| Immigrants | Ecuador | 0.0 /100 | #313 | Tragic 84.8% |
| Yaqui | 0.0 /100 | #314 | Tragic 84.7% |
| Puerto Ricans | 0.0 /100 | #315 | Tragic 84.7% |
| Belizeans | 0.0 /100 | #316 | Tragic 84.3% |
| Immigrants | Caribbean | 0.0 /100 | #317 | Tragic 84.3% |
| Immigrants | Belize | 0.0 /100 | #318 | Tragic 84.2% |
| Central American Indians | 0.0 /100 | #319 | Tragic 84.2% |
| Nicaraguans | 0.0 /100 | #320 | Tragic 84.1% |
| Yuman | 0.0 /100 | #321 | Tragic 84.0% |
| Lumbee | 0.0 /100 | #322 | Tragic 83.6% |
| Immigrants | Cuba | 0.0 /100 | #323 | Tragic 83.5% |
| Immigrants | Cabo Verde | 0.0 /100 | #324 | Tragic 83.3% |
Demographics Similar to Samoans by High School Diploma
In terms of high school diploma, the demographic groups most similar to Samoans are Portuguese (88.5%, a difference of 0.010%), Cherokee (88.5%, a difference of 0.010%), Inupiat (88.5%, a difference of 0.030%), Immigrants from Sierra Leone (88.6%, a difference of 0.050%), and Arapaho (88.6%, a difference of 0.060%).
| Demographics | Rating | Rank | High School Diploma |
| Somalis | 17.5 /100 | #203 | Poor 88.6% |
| Armenians | 17.2 /100 | #204 | Poor 88.6% |
| Immigrants | Micronesia | 16.4 /100 | #205 | Poor 88.6% |
| Arapaho | 16.1 /100 | #206 | Poor 88.6% |
| Immigrants | Sierra Leone | 15.8 /100 | #207 | Poor 88.6% |
| Portuguese | 14.4 /100 | #208 | Poor 88.5% |
| Cherokee | 14.3 /100 | #209 | Poor 88.5% |
| Samoans | 14.0 /100 | #210 | Poor 88.5% |
| Inupiat | 13.1 /100 | #211 | Poor 88.5% |
| South American Indians | 12.2 /100 | #212 | Poor 88.5% |
| Immigrants | Somalia | 11.3 /100 | #213 | Poor 88.4% |
| Immigrants | Cameroon | 10.9 /100 | #214 | Poor 88.4% |
| Crow | 10.9 /100 | #215 | Poor 88.4% |
| Chickasaw | 10.7 /100 | #216 | Poor 88.4% |
| Immigrants | Africa | 10.6 /100 | #217 | Poor 88.4% |